Architectural Design and visualization techniques.
A case study: Heusden.
Patricia Alkhoven
|
Architectural Design and visualization techniques. A case study: Heusden.
Patricia Alkhoven |
Chapter VI. Conclusions
Evaluation of computerized visualization
This chapter provides general concluding remarks about both Heusden's development over time and the contribution of visualization techniques to the research and analysis of the transformation of the city and urban management: What extra information can we draw from computer visualization and what is likely to be its impact on architectural historical research
The changing image of Heusden
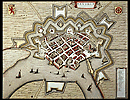
The clusters of production (c.1700, 1734-1740, 1840-1848) demonstrate a renewed interest in Heusden as a fortress town. A modest revival was caused by the establishment of light industries in Heusden in the second half of the 19th century. The shipyard (1905) set up on the Hollandia Bastion on the north-east side of town and the cannery factory (1910) founded just outside the Wijkse Poort provided employment for many inhabitants. Their strategic locations have prevented the town from unplanned expansion. Nowadays, these industries have developed enormously and are still the most important employers in the town. Only after the Second World War, when the town was in ruins, were serious initiatives undertaken to tackle the bad economic situation. Building activities developed rapidly; first through three Reconstruction Plans, which were only partly executed, and later through the modernist approach of redevelopment, with high-rise buildings on the outskirts of the town and street-widening. When the Redevelopment Plan was not approved by government and the only alternative appeared to be to reinforce the hidden visual and historic qualities of the townscape, the local government decided to restore the old 17th century appearance of the townscape as reflected in Blaeu's map. The restoration was carried out linking up with the traditional, compactly medieval town structure. The density of the existing structure was increased by filling the gaps in the street walls with new houses in adapted style (the inserted dwellings) and were reinterpretations of local architectural forms. Reconstruction and restoration of the former appearance also occurred.
The first restoration period of Heusden (1965-1978) has proven to be in general not as radical as was thus far believed. Various restoration approaches appear to have been applied. Only houses in the area around the Town Harbor and some individual buildings scattered over the town were rebuilt in old style. A few buildings were made to look older than they originally were to fit in harmoniously in their surroundings near the re-excavated Town Harbor, itself provided with a new draw-bridge and postmill. De-plastering only took place to a limited extent and the external appearance of buildings in the main streets was generally left unaltered.
The town architect, A. Peetoom, put his total view of the structure of the town into practice by responding to the characteristics of each different location. His use of Blaeu's map was limited to deriving information from it about the urban structure of the town and, in a general way, about the typology of buildings (orientation of ridges, scale, deep or transversal buildings). The typology used was limited to types available in the town, in combination with general information from Blaeu's types. In the second restoration period (1978-1990), the accent shifted to a more scenic approach to restoration. On the one hand, fewer houses were restored to their former appearance, while, on the other hand, reconstructed town gates and imaginary houses emerged. The acceleration of building activities (as we saw in the periods 1572-1620 and 1944-1990) generally causes radical change in a town, either in the form of structural change, through redevelopment, for example, or in the form we have seen in Heusden, restoration and reconstruction. One listed building (Wijksestraat 8), which is in a desparate state of repair, remains to be restored (Figure 141). It is to be hoped that restoration will never take place, so that the ruins of this building can be preserved as a reminder of how the town looked like before the restoration.
The restoration by Peetoom was probably a prerequisite, repairing and improving the existing urban structure, to provide a solid basis for later developments such as work by other architects in the second restoration period. Now that the structure has been repaired, the town can better absorb other kinds of architecture, hopefully in the future with some relatively modest examples of real contemporary design contributing to the city as a historical document.
Evaluation of computerized visualization
In this study, we have tried to answer the question of what extra information we can draw from computerized visualization, compared to traditional methods of research. To what extent can the computer contribute to visualizing the process of the changing image of the city over time? As mentioned before, all the drawing work can, in principle, be done manually, but it would certainly take many more years. Although using computer visualization techniques in research and analysis is time-consuming, it allows a more flexible way of studying the dynamics of the built environment.
One of the advantages which should not be underestimated is that the act of constructing the models forces one to focus in detail on the subject being studied. While constructing the models (i.e., making a graphical simulation), one learns about the structure, distribution of elements, sizes, scale, dimensions, characteristics, and regularities, etc. The creation of the computer models is in itself a way of studying the city, since it is an active mode of research and one is more actively involved in the process of research.
We used computer models in two different ways. First, we used computer models as a tool to assist the research, and, secondly we used them as a basis for analyses. Starting with the computer models to assist research, encouraging results were obtained with the two-dimensional morphological comparisons of old maps. These comparisons provided information about the possible morphological reliability of old maps much more quickly than was possible by hand. Alternative solutions could be tested directly as well. The same can be said of the tests done with the combination of the scanned two-dimensional image and the three-dimensional model. From the examples, we can conclude that in these cases the computer served to accelerate the research process.
The three-dimensional models turn out to be very useful in showing the plan, the spatial structure of the townscape, the houses, and the appearance of the façades at different periods and the city's transformation, land use, and the distribution of elements in a single model or in series. The juxtaposed phases show the complete process of transformation and continuity at the same level of detail. When seen from the same viewpoint, the change of a specific area can be examined. The most important quality of these spatial models is that they provide direct visual feed-back to the researcher during the project. Computer images can be consulted at all times. In other words, the computer images become a source of information themselves. Moreover, in order to be able to write Chapters IV and V we made interactive use of the three-dimensional models by using different scales, zooming in on details, comparing viewpoints, comparing heights, and so on. Thus, besides the traditional visual material, printed computer images from the six reference dates were used, and the models were often consulted interactively on the screen.
When detached from the three-dimensional models, the images of the façades (the street walls) provide a way of studying the development of each house in even more detail. They show us how the appearance of a building changes in relation to adjacent buildings, and what building style or exterior appearance is favored. In fact, the three-dimensional and two-dimensional models complement each other.
However, the visualization that we had in mind at the beginning of this project did not fulfill all our expectations. Three-dimensional models certainly provide better insight into the three-dimensional structure of a building than the traditional method. But the images do not explain what has changed between two phases, especially when seen from a distant viewpoint. A closer viewpoint immediately improves the possibilities for analysis. These three-dimensional, educational models can be improved in a way closely related to thematic cartography: by marking changes or elements by using different colors or symbols. This was done first with the images of the street walls (brick and plaster) and later with the three-dimensional model in which the different areas in the town were marked by colors (Figure 129). The same technique can be applied to indicate the changes between phases. In this way, the models can, to a certain extent, show what results the researcher has found. The exaggeration of certain features in the computerized maps served a double purpose. First of all, it enabled us to analyze the features on the same level of detail. Secondly, the visualization of these features is also the result of a conscious process of standardization of various kinds of visual material. One advantage is the possibility of standardizing heterogeneous visual material, for the benefit of morphological comparison of photos and other material, for instance. This functional use of the exaggeration of features brings us right back to the 17th-century conventions of depiction, in which the most important building were deliberately enlarged and the house types were standardized.
With respect to the presentation of the research results, the following comments can be made. The changes in the street walls can best be displayed with the different phases juxtaposed. This system is not new, as drawings from architects show. Many of the traditional `before and after' representations, by means of drawings or photographs, serve the same purpose. But it is difficult to find photographs of each period of time taken from the same vantage point. It is easier to make drawings by hand, but then each drawing has to be made separately, whereas computer images can be copied and used as many times as required. The same computer images of the façades can be arranged in different combinations, making regularities and characteristics of a specific group visible (type, façade characteristics, architects, year of construction, etc.) Each of these combinations - and there are many more possibilities - can make aspects of the complex nature of the city visible and understandable. The relation between these aspects tells us something about both the formation of the urban fabric and the logic of its spatial process over time. This visual database function allows for ordering and selection of visual material for an a posteriori reading of types in empirical research.
During the project it became clear that visualization of urban transformations introduces some aspects which it is important to deal with:
- We need different levels of scale. The first level consists of the geographical structure; then slowly zooming in on an urban scale, which will depend on the size of the city and finally the scale of the individual building. The complete area around the town needs a scale of about 1:12.500 in the traditional way. Heusden is small enough to be shown at the scale 1:1000. For Siena, which is much larger in scale than Heusden, Secchi uses the scale 1:5000. The individual building scale in Heusden is about 1:100 (Jantzen's street walls). But since the computer can display any required scale, this turned out to be more an issue of viewpoint and distance:
- The distance and viewpoint from which the models need to be viewed introduce the importance of appropriate representation and level of abstraction. For each of the specific aspects to be studied (the analysis of the plan, the perspective, the axonometric, or the total view in the three-dimensional models, etc.) the appropriate level of detail needs to be established. Clear decisions need to be (and were) made with respect to the amount of detail and elements to be displayed.
- A third complication appeared in the representation of changes (time, transformation, continuity, events, phenomena). In this project several ways were explored to visualize these changes: by means of the time-coordinates, in what can be called a space-time computer model (Chapter II); by means of layers of time in a three-dimensional model (Chapter IV) which can be animated by time sequencing; and by means of juxtaposition (three-dimensional models and street walls: Chapters IV and V), which still appears to be the most instructive way of showing developments over time.
A precise examination of a town in the manner described above will result in an impressive number of maps, as in the studies of Fortier and Secchi, each of them revealing specific aspects of the town. In time, these maps will, in turn, be used as documents or sources which need to be explained in their own context of time and place of production.
With respect to visualization, we can make a comparison with (a) the realization of the wooden model of Heusden made after the 1965 Development Plan and (b) the oblique projection map by Peetoom showing the first restoration period (c.1970). It took 3 people 8 years to complete the wooden model (8 x 5 meters) which is very detailed in showing wall textures, mullioned windows, and many other details. However, the model is not completely accurate. The Catharijne Church, for example, is here shown completed. All houses were built on a flat base (as our three-dimensional computer models). A physical model, however, is much more static than our computer models, which can be viewed from any distance or angle. The wooden model shows only one phase of Heusden's development, and this phase is not even represented accurately. It is clear from our project that the production of a three-dimensional computer model can be carried out much more easily in as much or even more detail. Besides that, the same computer model can be used for many other purposes and is thus much more flexible.
The project demonstrates that CAAD can be a powerful tool in
representing a townscape in three dimensions from different
angles, façades in their spatial context, and combinations
of different groups or types. Using CAAD allows for a better
understanding of the components of the city, their distribution,
formal analysis, relation with the context, proportions and their
process of change and continuity. In addition, it provides the
possibility of exploring many alternatives. The project also
demonstrates that detailed knowledge about a certain area of
interest as well as about the possibilities of computers is
required before a complicated project, such as the present study,
can be carried out. Since the computer models are the concrete
results of a study, they also allow other people to
verify these results. In this sense, we think it is
justified to describe the computer (to a certain extent) as
a flexible medium for educative purposes and historical
analysis.
Unlike most of the historical information projects which use the
top-down approach, we have carried out a more in-depth study using the empirical bottom-up approach.
The results of this study may be used in the future in a broader
context to link the information and the models with other kinds
of information in a multimedia environment.
Furthermore, it appears that two-dimensional representations (series of plans and façades) are still easier to realize and understand than three-dimensional representations. They also allow small differences in the façades to be analyzed. In fact, this is exactly what still usually occurs in architectural practice. Most architects design first sketching the elevation and ground plan. A three-dimensional representation usually follows later. This also appears to be the case with Peetoom's plans, but, although he does not explicitely deal in his plans with the spatial form of the town but rather with the townscape as seen in the streets, it is very clear from his concrete realizations that he implicitly considered the third dimension in detail as well. The oblique projection was never finished in detail for lack of time, but was meant and used as an instruction tool for other participants in the planning process - a use comparable with the possibilities of our own computer models.
As mentioned before, in understanding the town as a spatial construction, the three-dimensional models do give a good impression of the masses and even of the character of the town. Their value as a means of verification and communication of visual aspects of the built environment surpases any other visual medium. Our approach has therefore been closer to the practice of urban planning in The Netherlands, which makes considerable use of mass models and often only use block forms with flat roofs to distinguish between built-up and open areas.
Secchi and Fortier were able to include the interior disposition
of the houses in their research because they had much
cartographic material about these interiors at their disposal.
With the experiences gained from the Heusden project and the
construction (or reconstruction) of different historical periods,
one continuation could be in this area of interest, i.e. to
include interiors from a town which has material available about
the interiors, for example, Utrecht (Geïllustreerde
Beschrijving and the Bouwhistorische & Archeologische
Kronieken). Furthermore, easier techniques have now become
available for merging spatial form with landscape relief. These
extensions allow for an even more accurate approach with respect
to the visualization and analysis of development over time.