Architectural Design and visualization techniques.
A case study: Heusden.
Patricia Alkhoven
|
|
Architectural Design and visualization techniques. A case study: Heusden.
Patricia Alkhoven |
Chapter III. Heusden: Urban Development 1560-1900; Town Plans and Maps
3.2 Heusden c.1560-1579, the Map by Jacob van Deventer
3.3 Heusden 1579-1613, the Problem of Boxhorn
3.4 The Map by Joan Blaeu 1649
3.5 Developments in the Eighteenth and Nineteenth Centuries
During the restoration of Heusden (1965-1990), historical visual material played an important role in the establishment of the townscape. Maps and town plans were used in order to get a better understanding of the urban development of the town and its main buildings1. Well-known maps were, amongst a few others, those by Jacob van Deventer (c.1560), Marcus Zverii Boxhorn (1632), Joan Blaeu (1649), and Isaak Tirion (c.1743), each representing a different phase of Heusden's urban development.
In order to be able to interpret Heusden's urban development in the 20th century, it was necessary to have at least a general knowledge of the development of the town previous to 1900. We therefore decided to deal with this on the basis of the already mentioned maps and a selection of town plans, fortification maps and topographic maps found in Dutch archives2. This survey enabled us to gain knowledge about the changing morphological structure of the town and its buildings based on the maps and descriptions in literature, without being forced to carry out extensive research in the archives. Simultaneously, we could determine what kind of visual information about the urban development of the town - apart from the above-mentioned maps - would have been available to designers and planners during the restoration in the second half of the 20th century. In order to determine how reliable the maps are with respect to dimensions and depictions of buildings, each map, representing a different phase of Heusden's development, was carefully analyzed.
Historical research always involves analysis of written sources. If graphic material is used as a source from which information can be obtained, these graphic sources need to be analyzed as well3. The visual content of a map is as much dependent on those who commissioned it and drew it up and on contemporary conventions as written sources are. There are many examples of the use of town plans and maps in historical research4. In most of these studies town plans and maps are critically analyzed. In some cases, maps are reduced to the same scale. In other cases, even, graphic simulations and reconstructions are carried out5. As a basis for morphological comparison accurately measured cadastral maps from the first half of the 19th century have often been used. In the present study, some of the selected maps have been analyzed in the same way, but with the aid of two- and three-dimensional computer models6. Computer models make it possible to carry out a critical surveyance of maps by reducing them to the same scale and using the same viewpoint and level of standardization.
In the search for maps, our emphasis lay on plans and maps which provided information about the ground plan, the fortifications, the street pattern, and, if possible, the buildings. The use of topographic maps in this project was limited to a few important maps that were needed to explain unreliable town plans. In general, town plans in topographic maps are drawn at a scale too small for providing reliable information about the form of the town and its street pattern7. Other historical sources, such as literature, town descriptions and documents, were used to verify and support visual information obtained from the maps.
The following sections deal with the analysis of some of the selected maps on a two-dimensional level, which appears to be the best way to compare the lay-out of different maps. For this, the cadastral map surveyed in 1832 was used. It was the first map with precise dimensions and therefore appropriate for tracing back history to the first detailed map (c.1560, by J. van Deventer)8. Special attention has been given to the map by Joan Blaeu (1649), since its importance for the restoration (1965-1990) has often been emphasized by G.M. Scholten, who was Mayor of Heusden at the time. In order to detect the map's reliability and conventions of depiction, a three-dimensional computer reconstruction of this map has been made. In the following chapters this three-dimensional computer model will also be compared with the visualization of Heusden after the restoration campaign.
Cartography and fortifications
Cartography and the building of fortifications and extensions are closely related9. Whenever the physical form of a town changes, new designs and maps are needed to record these changes. Reasons for change or continuity of the image and structure of a town are manifold. The construction of new fortifications or extensions are the most radical changes for the urban structure10. With respect to this, first of all, new designs are needed for the construction of fortifications and after their realization, other maps are needed to record this new state11.
When making use of cartographic maps as visual sources in urban history and restoration, one is faced with the problem of their reliability. Before it becomes clear what useful and truthful visual information can be obtained from maps, they need to be carefully studied. Each kind has its own purpose, conventions of depiction, representation, symbols, and levels of information. Plans for strategic military use, for example, should be relatively precise in dimension, since the success of warfare is dependent upon reliable maps12. The dimensions and distances of the fortifications are based on the state of the art in artillery. Since fortification plans are usually designs for new fortifications or extensions, they do not always display the street pattern or buildings. However, most fortifications works - if realized as such - are drawn in detail. Militairy maps often provide detailed drawings of the existing fortifications, while in the same drawing the new design is drawn in a different color or in a dotted line13.
The reliability of town plans taken from town books or atlasses is often dependent on the publisher or printer. The commercial character of town books and atlasses in the old days meant that many town plans were copied from older (topographic) maps. The process of copying is, of course, not the most reliable way of producing maps. Sometimes small errors made in early maps were copied over and over again, persisting for decades or even centuries14. It also used to be common practice that future developments were drawn in older maps. This often makes it difficult to correctly interpret the information which the map provides.
For the present project, different kinds of maps were collected which provided visual information about Heusden. These included town plans for strategic military use, fortification plans, town plans from town books, and atlasses and topographic maps. The emphasis lay mainly on maps which were considered representative for a certain period of time in history and on maps which displayed detailed information about the urban morphology of Heusden. The purpose of this was to establish a solid basis for explaining the morphological change and continuity of the town. At the same time, something could be said about the structure and form of a town as a reflection of history and about the way maps reflect the self-image of a town15.
Heusden: fortress on the Meuse Heusden's turbulant history has been strongly determined by its geographical situation. Its position has always been a strategic one. The town of Heusden was founded probably in the 13th century at the crossing of two roads, situated in the bend of the Meuse River, an important trade route. Originally, the town was a fortress town or bastide, a town formed and extended in the neighborhood of a fortified castle16. Characteristic of a fortress town is its foundation as a seigniory, an autonomous town under a feudal lord. The town used to have its own laws, court and privileges. Heusden is a planned town, its main street being placed at right angles to the Meuse River and the Town Hall at the other end where the main street narrows into Breestraat. Its tower, though not impressively high, used to dominate the center. Behind the Town Hall is the Catharijne Church with its own churchyard. The town has a more or less rectangular ground plan - a medieval interpretation of the Roman castra17. The lay-out of the town does not seem to have any relation with the location of the castle18. It is believed that Heusden officially became a town in 123119.
The form of the area in which Heusden was located has always been determined by the ever-changing course of the Meuse River20. This changing course of the river and its strategic location meant that Heusden had to protect itself with dikes, earthen ramparts and later with thick, stone walls. It can also still be seen that the fronts of the houses on Vismarkt were built higher than the backs for reasons of protection against inundation by the Meuse21. The height of the ground level served as a retaining wall against the water. Heusden was always the target of battles between the provinces of Holland and Brabant and, as a consequence, subjected to attacks22. As a result of one of those battles, Heusden became part of the province of Holland in 1357, which it stayed till 1813. The Meuse formed the natural defense in the north but the land-side needed protection as well against armies. A defense system consisting of walls with towers and gates was therefore built in the fourteenth century to protect the inhabitants. In the course of time this defense system had to be adjusted more than once in order to withstand new forms of artillery and techniques of attack.
Heusden was an important place for crossing the Meuse River. An important part of Heusden's income came from the ships passing the town which had to pay toll. Heusden's primary functions were trade and agriculture. The town was nearly self-providing in keeping up the garrison and provisions for the region. Besides this, Heusden was also an important center for neighboring towns, providing several urban functions within its walls, such as the cantonal court, rates house, market.
According to Van Oudenhoven, the earliest form of Heusden looked like a rectangle with two 'lengths' at right angles to the Meuse River and a middle-axis23. The two lengths or parallel streets correspond to the present Waterpoort, Hoogstraat, Botermarkt, Breestraat and Putterstraat. The church used to be situated in a corner of the town and the castle just outside the rectangle. This possible thirteenth-century form can still be detected in the street pattern, but no drawing or topographic map has been found that could prove this in detail. Janse observes that there could be a connection between the construction of a sluice from the castle through the canal towards the Meuse in 1384 and the extension of the town at the same time. This new part of town was surrounded by water (Demer Canal) and stone walls with towers and gates24. In 1479 the meander of the Meuse was connected by a new channel north of Heusden, robbing the town of its direct position on the Meuse and thus of the toll money from passing ships25. Heusden was then situated on the Dead Meuse River. In 1515, 247 houses were counted26.
With respect to Heusden's main buildings, we know that the Catharijne Church was built in 1328, although the name Catharina appears already in documents in 121027. In the same period a women's convent was founded in Zustersteeg. The castle, founded in the 12th century, was enriched with a huge octagonal tower in 1380. In 1382 a Cistercian monastery Mariënkroon was founded outside the town and an Old Men's Home already existed in 1397 in what is now called Lombardstraat. The late-Gothic Town Hall (destroyed in 1944) was constructed in 1461 and formed the center of town. In 1482 a new convent, the St. Catharina convent, was founded in Zustersteeg28.
3.2 Heusden c.1560-1579, the Map by Jacob van Deventer
The earliest map showing the lay-out of Heusden in detail was depicted by Jacob van Deventer around 156029. In 1558 Jacob van Deventer was ordered by De Gewestelijke Staten (provincial government) by the Spanish king Philips II, to delineate some 250 town plans for the Seventeen Provinces in The Netherlands30. Between 1536-1546 he had already drawn topographic maps of the provinces of Brabant, Holland, Gelderland, Friesland and Zeeland31. Though the topographic maps show the towns on a very small scale he had seen most of the towns with his own eyes. He had probably delineated some of the town plans simultaneously.
Much research has been carried out to prove the geometric reliability of the town plans by Van Deventer. Generally, scholars seem to agree on the fact that Van Deventer's series of town plans are remarkably accurate. The reason for this accuracy is probably that the town plans served military purposes32. Roads, rivers, walls and gates were therefore drawn with much precision. Van Deventer produced a unique series of town plans, which were all consistently drawn at the scale of approximately 1:8000 the orientation being North. Van Deventer must have arrived at such great accuracy by applying trigonometry or by means of a very consistent method of counting feet33.
Town plan, Jacob van Deventer c. 1560. ("Minute") Koninklijke Bibliotheek Brussels.
Although proof of Van Deventer's precision in other studies seemed already very convincing, a simple test with the computer was nevertheless carried out to compare the basic lay-out of Van Deventer's map with the cadastral map (1832). The outlines of the town blocks and the streets and walls in Van Deventer's map and those of the cadastral map were digitized. When both maps were brought on the same scale, the two projections appeared to match very well. The projection shows us that the present town-canal, Demer Canal, used to be the walled boundary in the middle of the 16th century. Even after 450 years, the basic street pattern of the core of the town can still be recognized. It turned out that part of Demer Canal had been diverted in the beginning of the 17th century. The larger building blocks were later cut through by new streets, such as Molenstraat and Nieuwstraat in (1603)34.
In Van Deventer's map the old rectangular form of the town is still visible. The town was extended on the land-side in the fourteenth century and surrounded by a thick stone wall with towers and a moat. The castle and the harbor were still outside the walls. The map clearly shows the most important buildings, castle, church, town hall, cloisters, gates and roads which are depicted in perspective projection. The streets inside the town are depicted in white, whereas houses are indicated by a darker color along the streets. Apart from the above-mentioned main buildings, two mills used to determine the townscape, one on a platform near the harbor and one near the Meuse River. There used to be three gates on the land-side (the Herptse Poort, Oudheusdense Poort and Wijkse Poort) and one on the water-side (the Veer Poort). In fact, there were two roads entering the town in the north-east. The northern road has a tower (c.1500) and the southern road enters the town through the Herptse Poort. Foundations of this gate were re-discovered during excavations in 197335. In 1504 another Old Men's House was built. South of the wall a suburb had arisen with a beguinage which was situated near the Old Meuse River. There was a logical system of roads that entered the town gates and connected directly to the streets inside the walls.
Since much research had already been done on Van Deventer's maps, the well matching result was not very surprising. It only confirmed the reliability of the information in Van Deventer's map. However, the comparison was carried out without making use of the exact scale of Van Deventer's map. Maintaining the relative scale of the cadastral map, Van Deventer's map was manipulated, e.g. rotated, translated or scaled. In this way a global comparison dealing with a formal analysis of two maps without distorting their relative dimensions can be carried out very quickly. Various alternatives can be tested subsequently.
3.3 Heusden 1579-1613, the Problem of Boxhorn As early as 1572, during the Eighty Years War (1568-1648), the town of Heusden asked the authorities to get permission to improve the existing reinforcement with the newest techniques of fortification36. After the Pacification of Gent (1576) Heusden joined the Unie van de Verenigde Nederlanden (Union of the United Netherlands) and, as a consequence, Heusden again became a very important target for the Spanish armies. In 1577 a renewed request was sent to the authorities for improvement of the town's defensive works. On 5 March 1579 Adriaan Anthoniszoon from Alkmaar, the well-known master of fortifications, and Thomas Thomaszoon, were commissioned by the Staten van Holland to design a new fortification plan for Heusden37. This plan was approved by the Prince of Oranje38. Unfortunately, these designs have not been found so far. According to the first fortification accounts, Heusden had started building these new bastioned fortifications in the course of 157939. Jacob Kemp, Schout (sheriff) of Gorinchem, was commissioned by the Staten van Holland to assist Adriaan Anthoniszoon and was appointed supervisor of the fortifications40. Adriaan Anthoniszoon stayed closely involved during the construction of the first bastioned reinforcement of Heusden41. The work on the fortifications continued at least till 1589 while Jacob Kemp and Adriaan Anthoniszoon are known to have been working in Heusden as late as 1594 and 1596 respectively42.
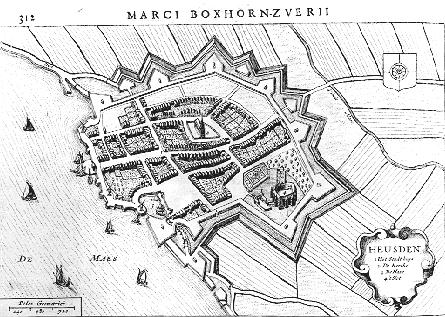
Except for some stone parts at the water-front, only a few traces of these fortifications have been found during the recent reconstruction, because the bastions were almost completely made of earth, and during the second bastioned extension in 1613, the first bastions disappeared completely. The second map which shows the lay-out of this first bastioned reinforcement of Heusden is part of a series of town plans which illustrate the Theatrum sive Hollandiae Comitatus et Urbium nova descriptio written by Marcus Zverii Boxhorn in 163243. There is no mention of an engraver.
Town plan, M.Z. Boxhorn 1632. Theatrum sive Hollandiae Comitatues et Urbium nova descriptio.
Almost all descriptions in the literature on the form of the first bastioned fortifications refer to the above-mentioned map by Boxhorn. Historians did not have much choice which map to use because only a few maps were available depicting the 1579 fortifications. These maps were usually (secret) fortification maps and none of the maps was more beautiful than the illustration by Boxhorn44. Supported by Boxhorn's image of Heusden, some historians claim that the dwelling area inside the fortifications had been extended during the 1579 fortifications45. What then happened to the Demer Canal? The Demer could not have been changed because its position is now, except for the diversion mentioned earlier, still very similar to the way it looked in 1560. When the town plan by Van Deventer, that by Boxhorn and a recent town plan were juxtaposed, the street pattern in Boxhorn seemed distorted, which was partly caused by a strip of new land just inside the fortifications. In order to find out more about the lay-out of the 1579 fortifications, the same comparative test as had been done with Van Deventer's map was carried out. The basic lay-out of Boxhorn's map was digitized and first projected together with Van Deventer's map in different colors. The maps seemed to match better when the extension was ignored.
A computer-assisted comparison between Boxhorn's map and the cadastral map (1832) produced the same results. If the extended part was taken into account the maps fitted badly, whereas the general lay-out seemed to match better when the fortifications in Boxhorn's map and the Demer Canal in Van Deventer's map were combined. Though some explanations seemed possible, this test could not prove what was wrong with Boxhorn's map. It merely served as a stimulus to search for further evidence. It was therefore necessary to study the history of Boxhorn's maps and historical descriptions in the archives and literature in more detail.
Many town plans from Boxhorn's Theatrum Hollandiae had been selected over a period of time and, as a consequence, their representations of the towns were often already out of date by the time of publication46. This seemed to be the case with Boxhorn's map of Heusden as well, since the second reinforcement had already been finished by 1620. Boxhorn's map shows the town while it was surrounded by walls and six small bastions, ravelins and a moat on the land-side and two bastions and a stone wall on the river-side. The town plan represented the houses in perspective, but, even though the main lay-out was recognizable, the street pattern was distorted. Compared to Van Deventer's map, the town seemed to be extended on the land-side, since a new, yet unbuilt strip of land had been added within the walls. The castle and harbor were also depicted inside the fortifications.
In general, most of the maps by Boxhorn appear to have been copied from older maps. Hoff thinks that topographic maps by Floris Balthasar van Berckenrode served as an example for several town plans in the Theatrum Hollandiae47. Floris Balthasar van Berckenrode and his son Balthasar Florisz usually travelled with armies and were hired to provide visual reports on the progress of military manoeuvres48. During those travels they also drew up maps ordered by the River Board. Their topographic maps are quite accurate in dimension.
However, differences and errors emerged when the small-scale town plans were enlarged and copied. A manuscript map of the Bommelerwaard including a town plan of Heusden (c.1608) which was never printed or distributed has been attributed to Van Berckenrode, based on the curly handwriting49. The similarity of Van Berckenrode's town plan and Boxhorn's is sufficient to assume that Boxhorn had indeed seen and copied the manuscript map of the Bommelerwaard. The bastions in Van Berckenrode's map, however, are irregular and somewhat smaller than the ones in Boxhorn's. Only the two bastions reinforcing the castle have a covered way and there are no ravelins. The Herptse Poort is depicted at the same place as in Van Deventer's map. Further, the map of the Bommelerwaard does not show any sign that the town had been extended within the fortifications. It could be that Boxhorn had copied the town plan only partly and probably not very precisely. Both Van Oudenhoven and Groen speak of only one real extension during the second reinforcement, which was to be constructed at the beginning of the 17th century. The first extension only concerned the area of the new fortifications which replaced the old stone wall50. The old moat became the Demer Canal.
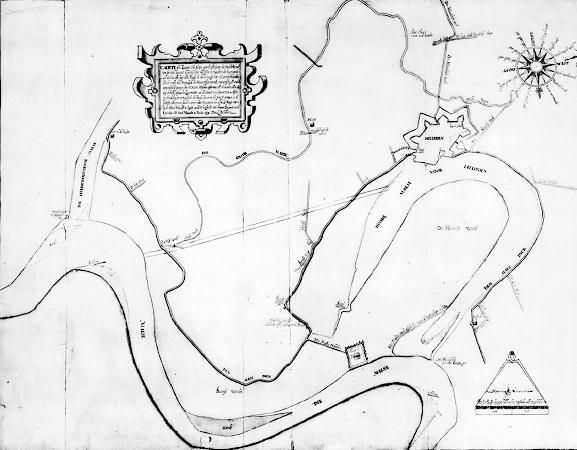
There is one other map which supports the idea that the town was not extended in 1579. It concerns a design by Daniel Schellincx in 1614 for changing the course of the Meuse River in the vicinity of Heusden51. Since this map by Schellincx had to serve this specific purpose, it must have been carefully surveyed. Only the contours of the fortifications are visible: seven small, irregular bastions surrounding the town.
Topographic map, D. Schellincx, 1614. ARA VTH 1443.
A computer projection of Schellincx's map and Van Deventer's map matched remarkably well. The bastions in Schellincx's map followed precisely the exterior of the walls of Van Deventer's map. The Demer Canal must have been situated just inside the new 1579 reinforcement. The result of a projection of Schellincx's map and the cadastral map also provided evidence that Schellincx's map is the correct representation of the fortifications as designed by Adriaan Anthoniszoon.
Given the importance and accuracy of the work by Schellincx (who actually lived in Heusden) and the results of the computer projections, Schellincx's representation of the fortifications of Heusden is probably the most reliable one. The other maps were either made for topographic reasons (Van Berckenrode), in which case the exact form of a town was less important, or for mere illustration (Boxhorn) in which the plan had to show the town to its best advantage. In many cases the maps by Boxhorn have been proved to be wrong or provide distorted representations of towns52. The fact that Boxhorn's image of Heusden was used by others appears from the fact that the same image was printed in 1639 in Colom's Map of Holland and even reprinted in 1681 by De Wit with a few changes in the fortifications which were never realized53. In 1681 some better maps were widely available (Freitag (1630); Blaeu (1649)) but there seemed to have been no real interest in truthful representations.
If we assume that the form of the fortications as represented by Daniel Schellincx is the most reliable form of Heusden after 1579, they can be described as follows. The new system laid out at the beginning of the Eighty Years War (1568-1648) needed to be implemented easily and quickly in order to avoid long periods of vulnerability to attacks while building the fortifications. Influenced by the new Italian fortification system the Old-Dutch Fortification System emerged at the end of the 16th century. The Dutch system consisted of pentagonal bastions which were placed at right angles to the ramparts. The 1579 reinforcement of Heusden was an early form of the Old-Dutch Fortification System with small, earthen pentagonal bastions still at relatively irregular distances and surrounded by a deep moat and earthen ramparts. The core of the town was left intact while the harbor and castle were enclosed within the new walls. The two bastions in front of the castle were extra reinforced. Schellincx's map shows us that there are still two roads near the Herptse Poort. Though the original designs have not been found, the new form of the reinforcement can easily be linked with ideas by Adriaan Anthoniszoon (1541-1620), who built many other fortifications in The Netherlands between 1573 and 160054. In 1578 he became a Master of Fortifications and in 1584 he was appointed superintendant of the fortifications of Holland and Utrecht55. The 1579 reinforcement is formally very similar to other fortifications built at the same time: a practical, effective fortress.
With regard to the information to be derived from Schellincx's map, it is unfortunate that the map does not provide any visual information about the houses and the urban morphology. From the literature, we know that around 1570 the town was almost completely built-up, with a church, two monasteries, an orphanage (1570) and four old people's homes which covered large areas in the town56. A great town fire in 1572, caused by an explosion of gunpowder, destroyed about one third of the buildings in Heusden including the Town Hall, the Catharijne Church and many houses along Ridderstraat, Engstraat, Breestraat, and Kerkstraat. The nave of the church was later rebuilt. After the great fire the houses along the streets were rebuilt57. The year anchors of Dordtse gables in Ridderstraat and Engstraat, for instance, state the year 1583. Once the harbor was within the new walls, a Water Poort (gate) was built in 1591.
An explanation for the errors in Boxhorn's map may be that Boxhorn had been aware of the fact that when he delineated the map (before 1632), works on the second fortification had already been finished. He must have `updated' the map by projecting the later extension within the existing contours of the map and by refining the fortifications with a covered way in the envelope and ravelins. The number of bastions equals the number of the 1613 fortifications. The street pattern had to be distorted in order to insert the later extension. In this way the map turned out to be a product of imagination: it represented neither an earlier stage of the town's development, nor a situation that was realized later.
In this section we have seen that Boxhorn's representation of Heusden has proved to be totally unreliable. Since the fortifications by Adriaan Anthoniszoon had lasted only a short period of time (1579-1613), there are not many maps available depicting the fortifications of that period. Although topographic maps of Van Berckenrode appear relatively reliable, the only map that, as far as we know, provides accurate information about the form of the 1579 fortifications, is the map by Daniel Schellincx of 1614. The activities in the town, such as the new fortifications and the rebuilding of a great part of town after the fire in 1572, show, apart from the successes in the war described in so many history books, the prosperity of Heusden at the time.
3.4 The Map by Joan Blaeu 1649
New techniques in the practice of warfare in the course of the Eighty Years War soon made improvements of the fortifications necessary. Though the fortifications that were constructed after 1579 were inspected on a regular basis, they had become in bad repair and the bastions were not properly positioned any more for effective defense59. Although the greater part of the Dutch fortifications had been provided with new fortifications before 160060, during the Twelve Year Truce (1609-1621) several towns took the opportunity to improve existing fortifications or to build new ones.
At the instance of Ghilliart, Count of Hoorn and Master of Kessel, Heusden started to build a completely new ring of fortifications in 161361. Thus, not a single fortification plan has been found nor a name of the designer of these fortifications. From the archives it became clear, however, that the works on the second bastioned fortifications must have started around 1613. The works on the new fortifications were finished around 162062.
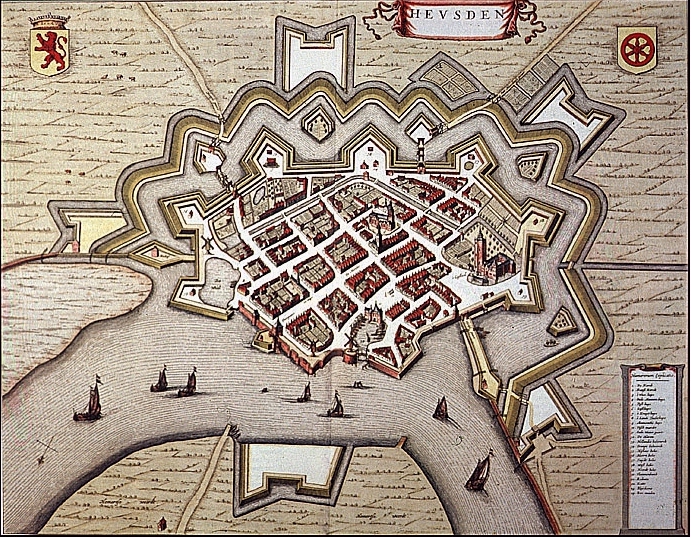
The town plan of Heusden from the Toonneel der Steden der Vereenighde Nederlanden met Hare Beschrijvingen (Townbooks of The Netherlands), by Joan Blaeu is the best known and the most beautiful town plan of Heusden which has come down to us from the 17th century63. This map shows how the practical early Old-Dutch Fortification System evolved into a more symmetrical system. Although the original medieval lay-out of the town was preserved, the extended town borrowed its idea of regularity from the surrounding new fortifications in non-regular octagonal form. Though the lay-out is not exactly regular, it has an optical symmetry. Seen from Blaeu's viewpoint, the town's left side can almost be mirrored onto its right side. Theories by Simon Stevin which advocate symmetry and regularity in mathematically ideal fortification systems, seem to have been applied here in a more pragmatic way64. Thus, Heusden can serve as an example of a town where the early practical Old-Dutch Fortification System with small bastions (Adriaan Anthoniszoon) made way for the improved old Dutch system with larger pentagonal bastions based on theories about ideal and symmetrical forms65.
The enlargement took place on the other side of the Demer Canal, while the Demer Canal itself was diverted, which enhanced the idea of symmetry. The old course of the Demer Canal can still be seen in the street pattern. In 1618 the new plots of land on the other side of the Demer Canal were leased out66. The Wiel, a pool probably caused by a breach in the dike near the Herptse Poort67, enclosed in the new fortifications, became a second harbor. The new fortifications consisted of eight large bastions, six at the land-side and two at the the river front. The Oranje-, Nassau-, Hoorn-, Zuider-, Wester-, and Noorder Bastion had a stone fausse-braye. In the moat between the ramparts and the envelope were five ravelins and one demi-lune while five horn works reinforced the outer envelope. Blaeu's town plan shows every single house in oblique parallel projection68 and the main buildings are drawn in great detail. For strategic reasons, the roads and gates no longer directly connect to the streets and the streets themselves are staggered. In Van Deventer's map the streets join at right angles, in Blaeu's map they are staggered in relation to one another. This was probably done to ensure a better defense in town. The extension was realized at the expense of houses situated outside the old ramparts in the direction of the old Meuse River. With the extension, the old Meuse River became part of the moat surrounding the town.
Blaeu: two-dimensional computer projections The town plans from the Townbooks of The Netherlands did not form a consistent series of maps. Blaeu had asked many towns to send him updated town plans and descriptions69. This encouraged many towns to have their town attractively represented. Other town plans were reproduced partly from older maps, like the ones by Van Berckenrode and Boxhorn. Towns with fortifications were probably copied from military maps, which Blaeu appears to have had at his disposal.
It was obvious that in Blaeu's map of Heusden the streets were depicted too wide and that the oblique parallel projection was chosen in order to show the elevations of the houses in detail and probably in an idealizing and abstracted way. Another 17th-century convention which can be detected in his map is the exaggerated representation of towers and important buildings. Keeping those conventions of depiction in mind, Blaeu's town plan was subjected to the computer projection test70.
The outlines of the building blocks and the fortifications of Blaeu's town plan and the cadastral map (1832) were digitized and projected on the same scale. When the two maps were compared in the traditional way by means of juxtaposition, they seemed quite similar. The combined computer models, however, showed amazing differences. If we take one point on the Hoorn Bastion as a starting-point, the fortifications fit to an acceptable extent, but in Blaeu's map the complete structure of the street pattern seems shifted. The main reason for this seems to be the shifted position of the Demer Canal. It turned out in Blaeu's map the bend of the canal had been drawn on the left side of the Hoorn Bastion whereas it should have been on the right side of the bastion. When the bend of the canal was taken as a new starting-point, the two maps appeared to match better, but then, of course, the fortifications did not fit any more. The explanation for the almost accurate dimensions of the fortifications is simple: Blaeu must have made use of fortification plans without the street patterns. Errors were made when the street pattern was drawn in later. The form of the harbor is not accurately drawn. In the cadastral map (and a very recent map as well) the former course of the Demer Canal can still be seen. In Blaeu's map however, these traces seem to have been erased and instead some neat rectangular town blocks with houses can be seen.
From these projections it became apparent that there was a discrepancy between the two maps, which caused a difference of about 10 degrees in the direction of the streets. The blocks of houses in Blaeu's map were subsequently stretched slightly in order to make it correspond better with the cadastral map. Although in this way the result was indeed improved, the right form could not be obtained without destroying too much of the original appearance. So, the wrong insertion of the street pattern also caused a difference of about 10 degrees in its direction. Since Blaeu's fortifications were proven to have been depicted relatively accurately and not to have changed much since the 17th century, a combination with a recent town plan (the visualization of the Development Plan) should match very well. In order to test this, another test was carried out by scanning a part of Blaeu's map (the fortifications without the street pattern) and combining this bitmap image with the three-dimensional model of the Development Plan 196571. The result obtained from this combination was that the old gates indeed turned out to connect well to the modern street pattern72. This result can serve as additional proof of the precision of Blaeu's fortifications.
Still, the question remains whether Blaeu did in fact use a town plan at all as a model. Our survey of maps and other visual material produced only a few maps depicted between c.1620 (the new fortifications) and 1648 (Blaeu). An engraving (1625) by Th. Matham depicting a view of Heusden under siege shows the new fortifications while the same view can be seen in the painting by Adriaan van der Venne (1625)73. Another early fortification plan appeared in Adam Freitag's Architectura Militaris, which was first printed in 163074. However, the form of the new fortifications is quite clumsily drawn and therefore could not have served as an example for Blaeu. Thus, it has to be assumed that Blaeu must have used other military maps or that perhaps the town of Heusden had provided an up-to-date town plan. However, so far this has not been proved.
Blaeu's town plan of Heusden was copied many times. First, the town plan
was reprinted in the town book by Johannes Janssonius in 1657 with reversed
shadows and an inserted view in the upper left corner75. The town plan in
Schauplatz des Niederlands was definitely based upon Blaeu's map, but shows
only the fortifications and the main buildings76. In 1698 Frederik de Wit had
Blaeu's map of Heusden reprinted in an atlas and Pierre van der Aa used a
copy of Johannes Janssonius' map as late as 172977. So, Blaeu's original map
of Heusden was used for over eighty years.
In the 17th century, the strong and impressive system of Heusden's
fortifications was highly praised in many town descriptions, books on fortifications, and poems, such as Guicchiardini, Van Oudenhoven, Groen,
Freitag, and the poem by Th. Matham78. However, contrary to what appears to
be a custom in other important 17th and 18th century towns in The
Netherlands, there does not seem to exist a tradition of representation-maps
of Heusden79. A representation of Heusden lacks in some of the most important
town-books such as the ones by Braun & Hogenberg and Mortier. In the
town-books which were published after Blaeu (1649), copies of Blaeu's map
were used80. Neither were any representational maps, commissioned by the
local authorities, produced. One reason for this could be the fact that the
fortifications did not change between 1650 and 1700 and, consequently, new
drawings were not required.
Blaeu: three-dimensional reconstruction
The depiction of the many town plans in the Townbook of The Netherlands show a variety of signatures. Since all towns, large and small, had to be drawn on approximately the same paper size, the scale varies from town to town. Besides that, Blaeu used 21 copies of Boxhorn's town plans, which are much smaller in size81. Most of the maps, however, are folio format. Because of the various scales, different levels of abstraction appear to have been applied. The town of Dordrecht, for instance, was drawn at a very low level of abstraction and is, in contrast to most of the other maps, represented in a very uniform way. Heusden and Gouda show a limited variety of types and include town-farm types. Larger towns, such as Leyden, Rotterdam, and 's-Hertogenbosch display more differentiation of types and the buildings are usually higher. Gorinchem has more detailed façades and, in general, Enkhuizen shows more detail. More research should be done in this field to enhance our knowledge about the applied levels of abstraction and conventions of depiction used.
For this study only the map of Heusden has been examined in detail. Most buildings seem to have stepped or pointed gables (spout gables). These "deep" buildings with the narrow front on the street, have mostly lower fronts with penthouses and windows in small divisions. The lower fronts are depicted as a horizontal band, with a door placed in the middle. Buildings on the main street are mostly deep (with the ridges at right angles to the street) whereas Putterstraat as a secondary street shows more variety of forms including many transversal buildings (which have the ridges parallel to the street). Windows are depicted as simple black spots or holes in the façades. Stringcourses are drawn as a single horizontal line. The types that can be distinguished are stepped and pointed deep gables (2-3 bays wide). The buildings on the main street have usually two floors above a ground floor. Buildings in Putterstraat have usually one floor less. Transversal houses are 4-5 bays wide. In general, the depiction of the façades shows too little detail to distinguish building styles or decorative details.
If we ignore the deficiencies of the street pattern, Blaeu's map provides detailed information about the morphology of the town. The complete new extension near the Oudheusdense Poort had already been built upon. However, the large area near the Herptse Poort was still unbuilt. In Blaeu's map, the narrow façades form a closed street wall with a clear structure of streets though not predictable like the perfect grid pattern. Elements which provide structure are the town gates, the Water Poort (constructed in 1591) and the Rates House next to it near Vismarkt. A third postmill can be seen near the Wiel. The town then consisted of 645 houses, the highest number counted in Heusden untill recently, and some 3200 inhabitants82.
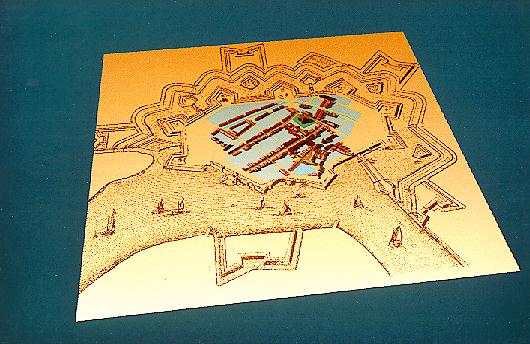
Since Blaeu's map was said to have been used during the restoration83, further research by means of a three-dimensional computer reconstruction was carried out. An investigation of the abstracted façades resulted in a typology. It consisted of about 15 basic types, which had different heights and widths. The basic measurements were taken from one of the houses that still exist (Vismarkt 1) and all the other measurements were related to them, since there were no original 17th-century drawings of the houses available. Based on those measurements the typology could be completed.
During the digitization of the ground plan, each town block was filled in with buildings following Blaeu's depiction. As in Blaeu's map, the terrain in the computer model was not given shape, except for the fortifications. The scanned map in the above-mentioned test is actually nothing more than a computerized image whose dimensions must correspond proportionally with the dimensions of the surface-plane it is projected on. Bitmap textures which are painted in a paintbox can be used as well for detailing the façades.
A bitmap texture of every façade type in the typology was painted in the paint program. By assigning a number to each texture map, a texture library for the project could be set up. Every plane in the model has been assigned a number which corresponds to the number of the texture map. The texture maps are then linked to the planes in the model by the rendering software. The vertical planes on which the gables are projected are not completely used by the textures of the stepped gables. These unused parts have been rendered transparent so that the real stepped gables become visible, even from the other side. Thus, instead of building the façades in three dimensions, a screen of painted façades has been put in front of the volumes of the houses.
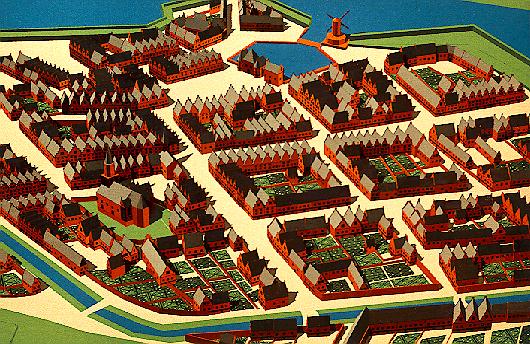
Computer perspective after Blaeu's map
Computer perspective of Blaeu's map with texture maps and shadow
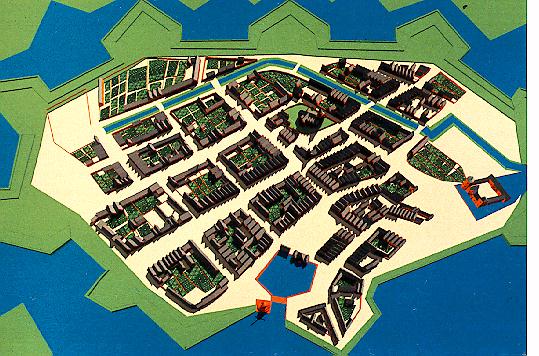
The advantage of this scenic architecture is that the appearance of the façades can easily be changed by assigning new numbers connected to other texture maps. Subsequently, the landmarks of the town (Catharijne Church, Castle, Town Hall, Water Poort and mills), which give the town its identification, have been modeled, too. Apart from depicting the above-mentioned landmarks, we also visualized the gardens and the fortifications.
Blaeu's oblique parallel projection has proved difficult to imitate without distorting the original appearance. First, a perspective overview as close as possible to Blaeu's viewpoint was chosen. The perspective turned out not to work to imitate Blaeu's view. In order to preserve the form of the fortifications, the viewpoint had to be situated high above, giving a bird's eye view. In this way, only the roofs of the houses are visible and not the façade detailing. The perspective of the computer model has also caused some distortions, due to the inherent conventions of the three-point computer perspective. Distortions can be seen, for instance, in the visualization of the form of the castle.
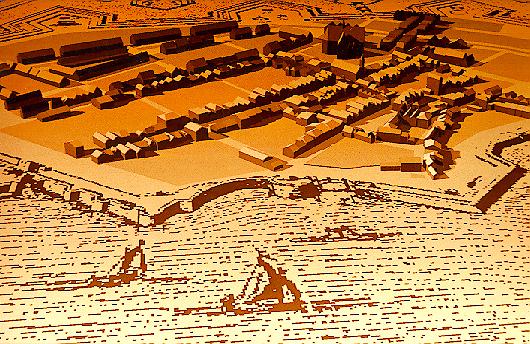
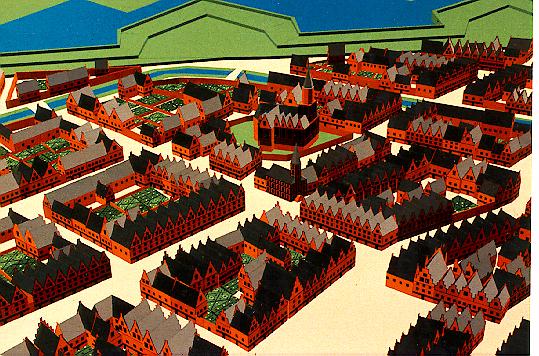
The model has subsequently been projected in isometric projection. Since the oblique projection of the houses in the map is close to an isometric projection, this projection corresponds much better to the map. Distortions such as the castle disappear and the viewpoint matches better. However, now that the façade detailing following Blaeu's depiction from a high vantage point can partly be seen, the form of the fortifications appears to be compressed. There is a discrepancy between the dimensions in the vertical directions of approximately 20%. The explanation for this is that the ground plan of the town was drawn in plan and the buildings were probably later drawn in in isometric projection. This means, that two kinds of projection are used in one drawing: plan and isometric. Though it is one of the conventions of 17th and 18th-century cartography to show the ground plan with the houses in oblique projection, even in the best three-dimensional computer visualization of the map, this discrepancy between the fortifications and the houses remains. Maintaining the form of the fortifications - which has proved to be relatively accurate - only the roofs of the houses (and not the elevations) can be seen. Thus, Blaeu's viewpoint is mathematically impossible to combine but very effective in showing as much information as possible.
From both the perspective and the isometric projections, it appeared that the height of the castle, church, harbor gate, and Town Hall had been exaggerated. The proportions of the Town Hall had been drawn completely wrong. The Town Hall as rebuilt after the great town fire of 1572 had three floors while the main building as depicted has only one and the tower is drawn far too high. The fortifications are shown in plan, as we have mentioned before, and for that reason, the wall near the waterfront which is displayed in isometric projection (it is given height on all sides but not in a consistent way), could in fact not be depicted in that way. Again, two kinds of projection were combined: the plan and the isometric projection.
Once the computer map is finished, it is possible to walk through the map or through the virtual streets with animation techniques. For this, a much closer viewpoint is needed. This zooming in causes the problem of the level of detail. The façade detailing which seems appropriate from a distance clearly lacks detail when seen from close by.
Computer perspective from the Town Harbor
Computer image after Blaeu's map, seen from close by.
Pen drawing, Joshua de Grave 1691.
Some 17th-century drawings show the real variety of detail of the Vismarkt houses. Another test was therefore carried out to replace the lack of detail in the map by Blaeu by more realistic façades and to correct the shifted street pattern. In order to do so, a part of the computer model (Vismarkt and Stadshaven) was rescaled following the cadastral map of 1832. Contemporary drawings and prints, such as the engraving by Josua de Grave, were used to detect the possible variety of the façades and compare them to the typology84. From these drawings and from the houses that still exist the characteristic features of the façades were extracted. These characteristic features are: the shape of the gable, the kind of windows and their architectural detailing, and the shape of the door. This visual information was used to paint new, more detailed texture maps. As for the houses of which no visual information was available, in most cases the dimensions and number of floors could be traced.
Since the houses at Vismarkt were too dark in Blaeu's map to clearly distinguish details, some houses appeared later to have been represented too wide in the computer model, witness the house on the corner Vismarkt and Nieuwstraat, which should have been only two bays wide. However, the idea of what the town might have looked like is more important. In accordance with the dimensions of the buildings, appropriate 17th-century façade types were inserted. Then the planes in the model were assigned new numbers and the image was rendered. The façades could then be viewed from closer by since the repainted façades were much more detailed. In this way the functional depiction of Blaeu's map was replaced by a more realistic view of how the town might have looked in the 17th century. In fact, one could speak here of the replacement of one abstract pattern (Blaeu) by another abstract pattern (repainted textures).
In concluding this critical survey, it should be noted that in spite of
all its (minor) deficiencies, Blaeu's map of Heusden has great historical
value. The map provides detailed information about the 1613 fortifications
(and is, as far as we know, the first printed town plan to do so), about the
houses and important buildings. There is a legend which explains the major
sites in Heusden and the map is decorated with the coat of arms of Heusden (a
red wheel on a field of gold) and the Province of Holland. However idealized
in some aspects, it certainly is the most beautiful map ever printed of
Heusden. If one knows its conventions of depiction, Blaeu's map succeeds in
providing a detailed impression of the situation around 1649 when the town
was at the height of its prosperity during the Dutch Golden Age.
Evaluation
So, the information that could have been used for the restoration
mainly involves the global urban morphology, the roads, and
location of the main buildings. With respect to the houses and
their façade characteristics, Blaeu's depiction appears
far too rough to show any recognizable details. However, the
number of stories can be detected and must be taken for granted
until proof to the contrary is found.
3.5 Developments in the Eighteenth and Nineteenth Centuries
Due to the continuation of peace in the region after the end of the Eighty Years War in 1648, there was little need for or interest in producing new maps of fortified towns. The annexation of first 's-Hertogenbosch in 1629 and later Breda in 1637 by the State troops slowly began to have a negative effect on Heusden's economy. In addition, the castle was ruined when it was struck by lightning in 1680. The horn works, which had fallen into disuse, were demolished at the end of the 17th century. According to maps and literature, the fortifications of Heusden did not change much until the turn of the century (c.1700), when the fortifications were further improved using the latest techniques of building fortifications85. The improvement consisted of a new outer envelope. The existing inner ring of fortifications was reinforced but left virtually intact. Also as part of the improvements one ravelin was added near the Wijkse Poort, a cat - a raised earthen section for the placement of artillery - was constructed at the Hoorn Bastion, and the covered way around the moat was fortified by re-entrant armed angles. The bastions on the river-side were reinforced by double stone ramparts. There is no account of who commissioned the improvements or who designed them. What we do know is that Menno van Coehoorn applied his method of making inundations for the area between Breda and Heusden (c.1701), which, however, did not affect the town of Heusden itself86. Van Coehoorn may have had some influence - probably through his assistants - on the construction of the improvements to the fortifications as well87.
There are several fortification maps available from the 18th century which show the above-mentioned improvements. Most of these maps give relatively precise measurements, displaying the fortifications in oblique projection, the lay-out of the street pattern and some of the main landmarks88. The first of these maps displaying the improved reinforcements were drawn in the period 1734-1740 by J.P. Prevost89. Prevost started in 1722 as an assistant to the contrarolleur-generaal (controller-general) with the special task of drawing up new town plans for the improvement of the fortifications of the frontier towns in Staats Brabant and of starting an updated registration of town plans90. In 1737-1762 he became the Contrarolleur Generaal himself and supervisor of the Grand Fortifications in Heusden.
The first series of maps by Prevost, including one of Heusden, showed the town and its surrounding area. In the second series, detailed town plans were all drawn on the same scale, 1:5700. These tinted plans displayed the town in ground plan and some of the main buildings and the improved fortifications in oblique projection. Cross-sections of the fortifications were drawn on separate sheets91. There is no indication that these fortification plans were used actively in the restoration. For that reason they have not been verified using computer overlays.
Isaak Tirion illustrated the description given of Heusden in his De Tegenwoordige Staat der Verenigde Nederlanden 1749 with a copper engraving showing the town plan in detail, with several views of Heusden and pictures of the castle ruins and the Town Hall92.
Even though the French method of drawing buildings in ground plan had already come into fashion93, Tirion's town plan still shows some of the main buildings in oblique projection. The conventions for town plans which were used as illustrations turned out to be less restrictive than those in military cartography. The information on Tirion's map is virtually the same as that on Prevost's map. It is not clear whether Tirion made his own survey or whether he copied other maps. Since most military maps were highly secret it is not very likely that he copied Prevost. In fact, secrecy was such, that even military surveyors sometimes had to copy their information from commercial, printed maps and plans94. If we compare Prevost (who certainly did his own surveying) and Tirion, we may conclude that both maps are - apart from certain minor differences - very reliable in their dimensions. Tirion's map of Heusden was distributed as an illustration in the De Tegenwoordige Staat der Verenigde Nederlanden and was therefore well-known.
Tirion could have copied this map from the town plan in J. Hartig's reprint of Van Oudenhoven (1743)95. The maps are very much alike, except that in Hartig's map the main buildings are depicted in plan. Hartig's map may be an original because the book it was made for dealt particularly with Heusden. This book was also printed before the first edition of the Tegenwoordige Staat. Tirion's book, however, was more widely distributed and for that reason Tirion's town plan rather than Hartig's is taken here to be representative. In any event, it seems that they used the same copper engraving. Both maps appear to have been used to a limited extent during the restoration. One reason for this may be that detailed information on the houses is lacking.
In 1752 Heusden became seat of the Grand Fortifications96. There are several other fortification maps available from the period 1773-1779, mostly drawn by D.G.B. Dalhoff, who had been working in Heusden since 177397.
Fortification plan by D.G.B. Dalhoff, 1774.
One of Dalhoff's maps (OPVH 422) from 1774, which also provided information about the profiles on separate sheets, was used for the restoration of the fortifications in 196898. This very precise map showed the fortifications and the surrounding land, roads, river, harbor, street pattern, the built areas (shown as low blocks), and gardens. The main buildings are indicated in ground plan. The three main gates (Wijkse Poort, Herptse Poort and Oudheusdense Poort) are still present. In this period the fortification maps also show the street pattern and sometimes the surrounding area99. The main lay-out of these 18th-century maps has been compared with that of the cadastral map of 1832. Since none of the maps tested deviates substantially from the cadastral map, computerized critical survey was abandoned. Other than the new extension of the fortifications, these maps do not add much new information about the urban morphology of Heusden, because buildings are not represented.
Heusden kept its privileges and lawcourt longer than most of the other
seigniories100. But the town was much impoverished around 1750 due to years
of raids, war, epidemics, and flooding. Few new houses were built and many
buildings of the existing building stock were renovated. The fact that the
rich years were over is shown in the decrease in the number of inhabitants.
In 1732 Heusden had some 2,700 inhabitants (3,200 in 1632) while in 1795 the
number of inhabitants had dwindled to about 2,400. Correspondingly, the
number of houses (in 1650 about 645) had decreased to 515 in 1730, and in
1807 only 460 houses were registered101. However, the fact that Heusden
still counted as a fortress can be gathered from successes achieved in
warfare. In 1793 the fortifications withstood the French armies and Landré
tells us that sometimes there were as many as 4,000 military men in town102.
The Batavian Republic was founded in 1795, an event which was commemorated in
an inscription in a newly constructed Fishmarket Hall on Vismarkt: An.-2.L.B., Anno Secundo Libertatis Batavae (In the second year of the Batavian
Freedom), i.e. 1796. The importance of the fortress in the 18th century is
also clear from the fact that great military surveyors Prevost 1734-1740 and
Dalhoff 1773-1779 had produced a series of plans and maps of Heusden. In
addition, the town plans and views of Heusden in Tirion's De Tegenwoordige
Staat der Verenigde Nederlanden 1749 became widespread.
The nineteenth century
Heusden, which had been part of Holland since 1357, became part of Brabant in 1813, a very poor province compared to Holland. The union with Belgium and the foundation of the Koninkrijk der Nederlanden (Kingdom of The Netherlands) in 1816 caused the discontinuation of Heusden as a fortress. As a result, the town was demoted to the secondary ring of fortifications. The fortifications fell into disrepair and after 1821 they were dismantled. The land was leased out as farmland, and the lease-holders were obliged to level the two-meter-high parapet103. The land was state property. Since the fortifications had been in use for more than 50 years, they were not allowed to be completely dismantled104.
Inundating became increasingly important as a means of defending the country. The inundated land would keep enemies at distance. River towns, such as Heusden, had the task of defending river-crossings. Heusden was part of the Zuider Waterlinie (south waterfront), one of the frontiers of the Hollandse Waterlinie, an extensive system of inundations throughout the country105. The fortifications and the town itself became less important, but the surrounding area with respect to the controll of the water and the sluices more106.
About 1812 the French demolished the spire of the Catharijne Church and replaced it with a kind of military signing device, leaving the tower truncated107. The Herptse Poort and Oudheusdense Poort were probably demolished in the first half of the 19th century (after 1832) because they had fallen into disuse108. Bridges over the moat were then replaced by dams revetted with brick109. Only in 1824 were the ruins of the castle, which had been destroyed in 1680, cleared, except for one tower which was used for storing gunpowder. Besides this, the Kaserne near the Demer Canal was repaired in 1837110, and in Sterrestraat an arsenal was set up, so that their military function was not yet completely over.
Following the French system of land registry, between 1810 and 1832 cadastral surveys were carried out in The Netherlands. In 1823 first a compiled map scale of 1:5000 was drawn up which displayed the built-up area in a very coarse way. Heusden was surveyed for a new, precise, cadastral map in 1832111. The cadastral map on the scale of 1:1250, in which every separate plot was indicated and which was the first map with precise measurements, has served ever since as a model for other maps.
In 1840 it was decided to defend Holland with an inner ring (`De Stelling van Amsterdam') and an outer ring of fortifications. Heusden was one of the few fortifications in the second ring112. This may explain why a new series of maps was drawn between 1842 and 1848113. These fortification plans mostly dealt with the leveled fortifications and the expropriation of leased land. In general, plans were drawn up as designs for new fortifications, for maintenance purposes, management, inspection, etc114. In 1842, with the threat of war still present, new fortification plans were drawn up by P.J. de Waal, proposing an improvement to the existing fortifications. The improvement consisted in the use of tenaillons to protect the ravelins and the bastions. The bastions were slightly concave and the courtines were convex. Although the new designs were never realized, they show clearly that Heusden was again considered an important factor in national defense115.
Two other maps that should be mentioned are the Rivierkaart (River Map) of 1854116 and the Gemeente Atlas (Local Atlas) of 1865117. Details of building density, the fortifications, gardens, the built-up and unbuilt-up areas can be seen more clearly on the Rivierkaart of 1854.
The enactment of the Vestingwet (Fortification Act) of 1874 meant the end of many active fortifications. When the garrison left in 1879, Heusden lost its greatest source of income and the number of inhabitants dropped to about 2,000. As a consequence of the bad economic situation, the fortifications again became delapidated at the end of the 19th century. Nonetheless, due to the setting up of some small factories, Heusden seemed to regain some of its prosperity, but only for a small minority. The number of people living on public charity had always been high, as can be deduced from the many measures of this sort taken by the local authorities and the existence of many old people's homes and the orphanage. The number of the poor increased sharply in the 19th century, especially when the staple town collapsed118. In 1899 there were only 1,893 inhabitants left. Apart from a few new warehouses, significant new buildings were a Synagogue (built in 1870) in Breestraat. Following the Postal Act of 1851, a Post Office was built in 1893 in front of the Town Hall.
We have now finished our survey of the maps which show the development of Heusden's urban morphology. The best way to present the different phases of development is to juxtapose the various maps. In juxtaposing the original maps one is confronted with the problem of their different manners of representating their subjects. Scale, aspect, ground plan or perspective, as well as different conventions of depiction hinder an unambiguous interpretation. A better way to make the growth of a town understandable, would be to merge the various phases into one single computer image.
In this way the computer drawings of the first rectangle (c.14th-c), Van Deventer (c.1560), Schellincx (1614) (1579 fortifications), Blaeu (1649) (1613 fortifications), and cadastral map (1832) (improvements) can be combined and projected in different colors or, when displayed in black and white, with different line-widths. This was done and the resulting image shows how Heusden developed from two parallel main streets near a castle in the Middle Ages via a walled town with towers (c.1560, Van Deventer) to the early bastioned reinforcement based on the Old-Dutch Fortification System (1579-1613, Schellincx). The early form of this system was later replaced by a more ideal form of the Old-Dutch Fortification System which involved the extension of the town (1613-c.1700, Blaeu). The present lay-out still looks very much the same after the improvements of past 1700 had been implemented (cadastral map).
In this chapter, the urban development of Heusden has been sketched using town plans and maps, the reliability of which was analyzed. Significant was the question of the form of Heusden's first bastioned reinforcement (1579-1613). From the two-dimensional computer projections, it turned out that Boxhorn's map was wrong at several points. The results of our simple computer projection of Boxhorn's map were incentives to look further not only for town plans but also for topographic maps. Eventually, Schellincx's topographic map turned out to provide a more reliable representation.
In this respect, positive results were obtained with the projections of Blaeu's map (1649), from which it appeared that the fortifications were relatively accurate but the street pattern had been drawn in wrongly. Further research is sometimes necessary to explain why and how this was done. To judge from these results, two-dimensional morphological comparisons of the lay-out of the old maps appears to provide a relatively simple method for historians to pursue research and analysis in this area119. It is certainly an advantage that computer projections can explore every possible option. Especially in cases where not much additional data is available, one can at least form hypotheses. The computer can thus serve as the accelerator of the research process. The test with the three-dimensional visualization of Blaeu's map indicated that these new techniques can be useful in investigating the conventions of depiction, perspective projection, the structure of a town, difference in heights, proportions and, from close-up, the building typology.
The list of town plans120 shows that, when the reconstruction of the fortifications started after the Second World War, many reliable 18th-century maps were available for designers and planners. As will be described in the next chapter, only some of the maps were used for the restoration of the fortifications (Dalhoff 1774). With respect to the restoration of the town and its buildings, it is logical that Blaeu's map was taken as a model since the amount of detailed information in it is considerable. No plan or physical model can compete with the imagination of a detailed historical map. As a rule most maps produced after 1750 do - following contemporary drawing conventions - no longer display the individual houses. It was probably for this reason that they were not used for the restoration.
Notes:
1. Peetoom 1966, 135-140; Scholten 1971, 1298.
2. The search for maps of Heusden was limited to the most appropriate archives: "Algemeen Rijks Archief" (A.R.A.), The Hague; "Provinciaal Rijks Archief", 's-Hertogenbosch; "Streekarchief van het Land van Heusden en Altena", Heusden; "Library of the University of Leyden" (collection Bodel Nijenhuis); collection "Atlas van Stolk" Rotterdam.
3. Fockema Andreae 1947; Van 't Hoff 1941-1943, 29-68; 97-150; Koeman 1983; Koeman 1984; Kok 1984; Van Mingroot 1989.
4. See for example: Donkersloot 1989; 1990; Fortier 1989; Heinemeijer et al. 1987; Henderikx et al. 1990; Hoeven & Louwe 1985; Smook 1984; Taverne 1978.
5. Smook 1984; Henderikx et al. 1990; Hoeven & Louwe 1985.
6. A computer-assisted method to analyze the accuracy of topographic maps has been developed by Mekenkamp & Koop (1986).
7. Many sixteenth- and seventeenth-century topographic maps including Heusden can be found in Duncker & Weiss 1983.
8. The nineteenth-century cadastral maps are often used in other projects tracing the past by means of town plans and maps. See, for example: Smook 1984; Henderikx et al. 1990. Cf. Conzen 1971.
9. Scholten 1989.
10. See, for literature about the development of fortifications: Schukking 1937; 1988; Sneep 1982. About architectural elements of fortifications: Vermeulen 1937; Janse & Van Straalen 1974.
11. Hoff 1941, 101.
12. Scholten 1989, 9.
13. Scholten 1989, 23.
14. Hoff 1966, 30-31; Koeman 1983, 131.
15. Cf. Reiner & Hindery 1984.
16. Fortress-town: described as "kasteelbastide-stad" in: Arthur Steegh 1985, 81; 150. Burke 1956, 53-63. Fockema Andraea & Ter Kuile 1948, Vol. I. 118-119.
17. Ibidem.
18. Fochema Andreae & Ter Kuile 1948, 72.
19. Van der Aa 1844, 545. It is not certain if or when Heusden was given official "city-rights". Kool-Blokland (1985, 3) argues that Heusden was given "city-rights" between 1290 and 1295.
20. For historical geography, archeology and demography, see: Thijssen 1989a+b (the struggle against the water in Heusden); Braams 1990; Hendriks 1990 (demography and archaeology); Hoppenbrouwers 1992 (the land of Heusden 1360-1515). For historical facts: Van Oudenhoven 1651+1743; Groen 1742; Van der Aa 1844.
21. A. Peetoom 1980, 23-30.
22. Descriptions of the many battles of Heusden can be found in: Van Oudenhoven 1651; 1743; Groen 1742; Van der Aa 1844; De Munck 1970.
23. Janse 1986, 214; Van Oudenhoven 1651, 5. 24. Van Oudenhoven 1651, 1.: "De Forme van 't eerste Begrijp van deze Stadt was lanckwerpigh met twee lenghten bij nae Oost en West uytloopende."
25. Thijssen 1989B.
26. Tirion 1749, 256.
27. Van Oudenhoven 1651, 9.
28. De Munck 1970, 17.
29. For this project the facsimile edition 1916-1923 was used, with an introduction by R. Fruin, map 54. For literature about the maps of Jacob van Deventer, see: Fruin 1916, Hoff 1941, Koeman 1983, 118-124, Visser 1984, Deys 1989, Koeman & Visser 1992. Belgische Cartografie in Spaanse verzamelingen van de 16e tot de 18de eeuw, Brussel 1985, 28-31, shows both the original and the "minute" with study. With thanks to J.C. Visser who brought this to my attention.
30. Deys 1989, 81.
31. Hoff 1941, 33.
32. Hoff 1941, 31; Koeman 1983, 124.
33. Koeman 1983, 121-123; Deys 1989; Koeman & Visser 1992.
34. Peetoom 1965, Explanation Development Plan (Toelichting bij het Bestemmingsplan Heusden Stad).
35. Heusden Streekarchief, Oud Archief inv.nr. H1.. Janse & Van Straalen 1974, 98-99.
36. Heusden Streekarchief, Oud Archief inv. nr H1. (The first fortification account). Westra 1992, 37.
37. Ibidem.
38. Oud Archief Heusden inv. nr. H1.
39. Westra 1992, 46-47.
40. Oud Archief Heusden, inv. nr. H1-4.
41. Westra 1992, 104.
42. Boxhorn 1632, 294-97.
43. These military maps became only publicly accessible after 1960 when the military archives and maps were transported to the Algemeen Rijks Archief (ARA). Koeman 1983, 166-167.
44. Munck 1970, Dijkstra 1992; Stichting Menno van Coehoorn "Atlas van Historische Vestingwerken" 1958 -.
45. Hoff 1941, 111.
46. Hoff 1941, 110-111.
47. Zandvliet 1980, in: Sneep 1980, 169; description in . Donkersloot 1981, 41; Scholten 1989, 21.
48. Groen 1742, 41: "De eerste vergrootinge, dog gering zijnde, is geschiet aengaande de stads mueren, an de Land zijde, dewelke afgeworpen zijn en in plaats van die geleijt een aerde wal met eenige uitstekende hoeken hier en daer en bolwerken..". Van Oudenhoven 1651, 1: "De stads haven (...) is met de vergrootinge (1579, PA) van de Stadt binnen de Stadt gebragt waer van dat noch eenighe teeckenen bespeurt worden, ende meer weynige jaren geleden gesien zijn. (...) ten tijde van 't Gouvernement van sijn Genade den Grave van Hoorn (1613 PA) (...) is dese Stadt om deselve te meer te sterken vrij verre uitgeleydt aen den Herpsche ende Oudt-Heusdensche Poorten ende is dat vergroot deel van dese Stadt soo groot dat het wel meriteert den naem van Nieuw-stadt".
49. Donkersloot 1981, 143-144, nr. 726, A.R.A. VTH 1443.
50. Hoff 1941, 111-112; Koeman 1983, 130-131.
51. Jacob Aerts Colom's Kaart van Holland, UBA, 1639 and F. de Wit excudit, Comitatus Hollandiae et Dominii Ultraiectini Tabula, 1681, lit. Koeman 1983, 95.
52. See, for a description of the work by Adriaan Anthoniszoon, Westra 1992, 36-44.
53. Sneep 1982, 19; Westra 1992, 39.
54. Peetoom 1965, 2.
55. Van Oudenhoven 1651, 52-53.
56. Van Oudenhoven 1651, 53; Groen 1742, 41-42.
57. See, Westra 1992.
58. Van Oudenhoven 1651, 2, 58; Groen 1742, Pape 1824, 29-30.
59. "1613....Over de muur van 't Ravelijn tussen de 2 voorste Beeren, den aannemer bestraft tegens 't Bestek gewerkt te hebben." Contrarolleur- Generaal 's Lands Werken en Fortificatien van Holland 1630 - 1806. A.R.A. 3.01.43, inv.no 7. Since this chapter is based on town plans and maps, extensive research in the archives would have been out of scope. However, the above-mentioned source could provide more information about the development of the fortifications.
60. See, for example the town view by Th. Matham, Atlas van Stolk, Rotterdam 1625.
61. Joan Blaeu, Toonneel der Steden der Vereenighde Nederlanden met Hare Beschrijvingen 1649, facsimile: 1966, with an introduction by B. van 't Hoff. Original in Bibliotheca Thysiana, Leyden. For further literature about Blaeu see: Hoff 1941; Hoff 1947; Koeman 1983; Koeman 1985.
62. Taverne 1978, 39, 55-56; Van den Heuvel 1991, 139-148.
63. Ibidem.
64. Janse 1986, 215.
65. Hamoen 1978.
66. C. Koeman 1983 introduces the expression of 'scheve parallel projectie' here translated into 'oblique parallel projection'. The oblique parallel projection is closely related to the axonometric which is considered the most technical and 'objective' view, displaying information about the plan as well as the facade detailing in three-dimensional projection. See, also: Drexler 1977.
67. Koeman 1983, 130.
68. See also: Alkhoven 1992A and 1992B.
69. See for a description of the Development Plan: Chapter II and Chapter IV.
70. The three-dimensional model should have been projected slightly larger within the scanned area in order to fit better. At the time the test was carried out it was still technically very difficult to combine the two images. I therefore refrained from producing an improved combination.
71. Atlas van Stolk, Rotterdam 1625, "Th. Matham fecit, Clemendt de Jonge excudit"; "'s Lands Sterkte", painting by Adriaan van der Venne, 1625, British Museum. It is not certain who copied who.
72. Adam Freitag 1630.
73. Johannes Janssonius 1657.
74. Schauplatz des Niederlands, Wien, 1673, pl.71.
75. Koeman 1985, 189.
76. Guicchiardini 1612, 227; Van Oudenhoven 1651; Groen 1657; Freitag 1630; the poem by Th. Matham 1625 (Atlas van Stolk, Rotterdam).
77. For representation maps of Amsterdam, see, for instance: Heinemeijer et al. 1989. Utrecht: Donkersloot 1989; 1990.
78. Koeman 1967-1985. Vol. I, 296.
79. Van 't Hoff 1966, 30.
80. Tirion 1749, 256.
81. Scholten 1971; 1975A; 1975B.
82. Breitbart-Van der Stok 1969, 105; 111.
83. See, for instance the plan of Heusden in Tirion 1749, to be discussed later.
84. Scholten 1989, 45.
85. Van Coehoorn, Director-General of Fortifications (1695-1704), became well known for introducing the New Dutch Fortification System according to which many towns (but not Heusden) were reinforced at the end of the seventeenth century. See for a description of the New Dutch Fortification System: Schukking 1988.
>86. Fortification maps of Heusden in ARA: OMM, OPVH, OSK, VTHR, OSPV, OSV, OBZ, OPGO. See also Appendix I, and Scholten 1989, 208-209.
87. Prevost, OSKB 68; OPVH 417. Scholten 1989, 63.
88. Scholten 1989, 50; 65-67. A detailed study of information provided by "Contrarolleur- Generaal 's Lands Werken en Fortificatien van Holland 1630 - 1806" was beyond the scope of the present work. A.R.A. 3.01.43. This register kept track of even the smallest of improvements to the fortifications during the period 1613-1813.
89. Ibid.
90. Tirion 1749, 250-266.
91. Koeman 1983, 164.
92. Scholten 1989, 75.
93. Van Oudenhoven 1743.
94. Scholten 1989, 83-84.
95. Scholten 1989, 84; Dalhoff: OPVH 412; OSPVH 68, ARA.
96. Ter Laak 1983, 8.
97. Scholten 1989, 86.
98. Landré 1884, 220.
99. Tirion 1749, 259.
100. Landré 1884, 220.
101. Koninklijk Besluit 23 mei 1821, nr. 24. Sinninghe (1963) claims that this act was only a draft and that it was never ratified. I believe he is wrong on this point, because on some official military maps made after 1821 it is written that those maps were drawn for the benefit of the "leveled fortifications of the town of Heusden". (de geslegte vestingwerken der stad Heusden). ARA: OPVH 428; OPVH 432.
102. See, Chapter I, 1.2.
103. For information about the "Hollandse Waterlinie", see: Brand & Brand 1988.
104. Akihary & Behagel 1982, 107-108.
105. De Munck 1970, 43.
106. About the function and demolition of town gates in the first half of the 19th century, see: Van der Woud 1987, 336-340.
107. Schukking 1942, 32.
108. Van der Aa 1844, 546.
109. Verzamelings Kaart van de Kadastrale Plans der Gemeente Heusden Opgemaakt in het jaar 1823 op de schaal van 1 tot 5000.
110. Van der Woud 1987, 474.
111. KB 8/07/1844 Heusden belonged to the third category of fortifications.
112. Scholten 1989, 9-11.
113. ARA: OPVH 428 and OPVH 429.
114. Rivierkaart 1854, map 32, UBA.
115. J. Kuyper, "Gemeente Atlas 1865 van Nederland naar officiëlen bronnen bewerkt".
116. De Munck 1970, 46.
117. Cartographers, however, may consider the manner in which the measurements were entered into the computer as too inaccurate for their purposes. For more detailed cartographic research, one always has to use the original source map. In addition, the method of measuring (trigonometry or otherwise) and the amount of shrinkage of the paper on which the map was originally drawn also have to be taken into account.
118. Appendix I. Other maps of Heusden can possibly be found in other national and international archives, e.g. the "Koninklijk Huis Archief", The Hague; Dienst Nationale Museum Archieven, The Hague; "Krigsarkivet", Stockholm (Sweden). Van Oerle 1987, 80-83, and Zandvliet 1991, 154-160, suggest locations where more maps of Heusden (and other fortification towns) may perhaps be found.
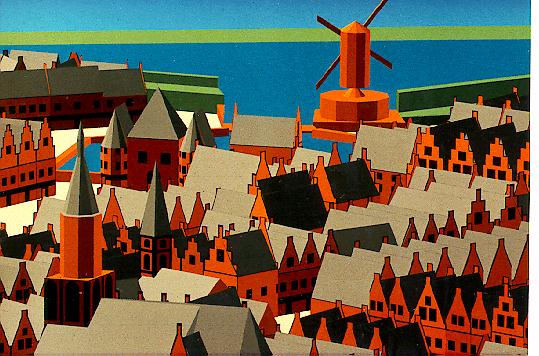
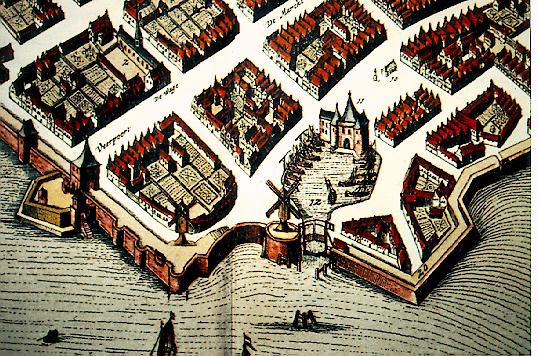
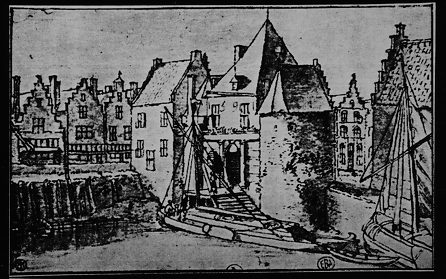
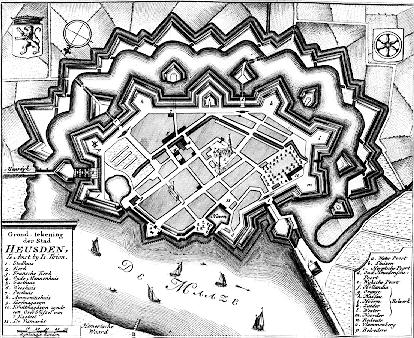
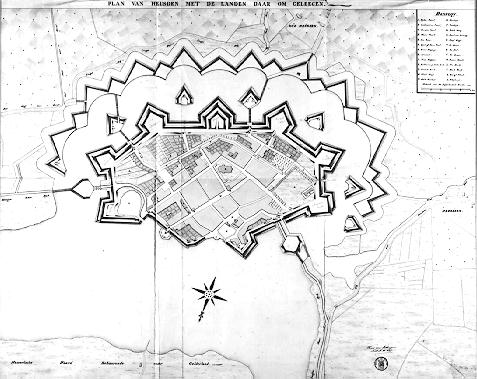
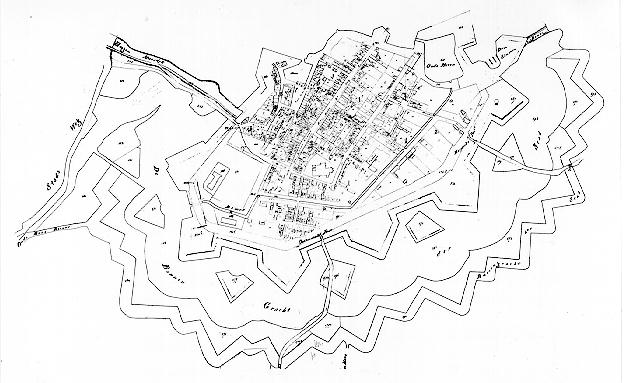
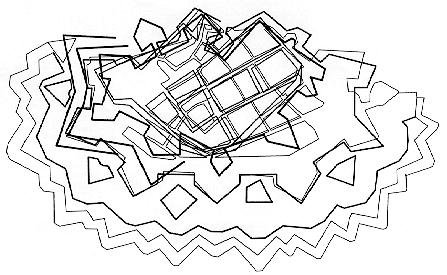