Architectural Design and visualization techniques.
A case study: Heusden.
Patricia Alkhoven
|
Architectural Design and visualization techniques. A case study: Heusden.
Patricia Alkhoven |
Chapter II. Computer-Aided Architectural Design (CAAD) and the Research of Heusden
2.2 Current CAAD and Visualization Techniques in Architecture
The three-dimensional visualization of the development Plan 1965
Applications and visualization of the development over time
After the general information which we have dealt with with respect to the urban structure, its components, transformation and regulations in the previous chapter, this chapter assesses the computer-assisted and methodological framework of the research project.
In order to tackle the complexity of the townscape of Heusden, the focus is, as mentioned before, on the research of the transformation of the spatial structure of the townscape. This being the case, we now need to know how the process of change and continuation of the townscape can be represented and made understandable by means of visualization techniques. In connection with this, the question needs to be answered what kind of and how much visual information is necessary for the computer models of Heusden to provide a basis for interpreting the changes over time.
The first section of this chapter starts with a description of the architectural representation and its conventions of depiction. The architectural drawing and other conventional representations, such as the physical model, are first of all important sources for architectural historical research. At a later stadium the computer images can be compared with these conventional representations. Some general usages and applications of the computer and Computer-Aided Design (CAD) in Art and Architectural History have already been described by Stenvert1. The second sub-section therefore only deals with the basic concepts and techniques of CAAD and visualization, needed for a better understanding of the present work. Current applications of three-dimensional computer visualization in the research of the city are subsequently assessed.
In the second section, a description is given of two pilot projects which were carried out to test some of the defined goals and possibilities. In the first project, the Development Plan of Heusden (1965), being the building envelop for later development in the town, was visualized three-dimensionally. The second pilot project focused on the problem of how detailed the computer models should be for the project.
Based on applications mentioned in the first section and on our own experiences described in the second section, the third section describes the methods and techniques of CAAD and their limitations, as tested on Heusden.
2.2 Current CAAD and Visualization Techniques in Architecture
This section deals with methods of architectural representation as well as some techniques and applications of CAAD and visualization with respect to architecture and architectural research. Drawings and other visual representations of architectural objects and ensembles are the most important visual sources for architectural historical research. Therefore, before addressing computerized representations in architecture, architectural drawings, their conventions and methods of representation need to be discussed. Some basic CAD operations with which two and three-dimensional computer models can be constructed and changed are very briefly discussed in the second sub-section. A few recent applications of CAD in researching and designing cities which have some connections with the visualization of Heusden are described at the end of this section.
Computer graphics is the general term for both vector-based (Computer-Aided Design) and raster-based (bitmap) techniques of computer imagery or visualization2. The present work deals mainly with CAD-techniques, but bitmaps are also used sometimes in combination with CAD. Much has been written about the developments in CAD and its applications in design and education3. Since this is a fast developing field, the latest applications will probably be outdated in a couple of years. A description of the state of the art in computer graphics as such therefore serves no purpose in the present study. Since the performance of the computer is not a central point in the approach, only some general concepts of CAD and visualization will be assessed here.
The term visualization may be defined as a mental image4, but here, the definition to make something visible is preferred. The latter meaning is close to this project's definition: visualization is the visual result of computer-generated imagery on the computer screen or in any output format. An important difference between visualization and representation should be mentioned here. According to Wright, "a representation re-presents an object in another form or substance such that its essential features remain or directly translate into that new form. Visualization is a specifically selective representation of data in order to produce the desired knowledge. It models certain variables and ignores others, uses certain types of geometry or scalings or filters to make some aspects more apparent and perceptible."[my italics PA]5 When dealing with phenomena which are already recognizable visual entities (such as the built environment) these two terms seem difficult to discriminate, but Wright's distinction can be applied in this case as well. Following Wright's definition, the computer models of Heusden which will be discussed here are visualizations of concepts of presentation and planning because they display selected data or features. These visualizations, however, are often based on representations, namely drawings.
Representation in architecture
To study the built environment means first of all to examine existing buildings. The most accurate method is to measure the buildings anew, by means of a so-called `site survey'. A precise way to measure façades is, for instance, by means of photogrammetry to produce orthographically scaled drawings using stereo photographs6. A site survey introduces the problem of the complexity of the building, its construction, its material, its size, and its dimensions, which makes a good survey very time-consuming. The measuring of a single building does not present a real problem, but the survey of an entire town would probably be too ambitious7.
Apart from studying existing buildings, the history of architecture is, as in our case, mostly studied through architectural drawings, since drawings are usually more easily manageable because of their size. As a two-dimensional representation of a three-dimensional object, every drawing is an abstraction from reality. Depending on the level of abstraction chosen, each kind of architectural drawing has its own conventions of depiction in time and place8. The conventions or interpretations need to be known in order to be able to interpret drawings properly.
In this respect, various kinds of drawings which are produced at different moments in the building process need to be distinguished. First of all, there is the visual representation of the idea of the building to be constructed, the design. In the course of a project, designs are often changed or adapted to new requirements. The final design is usually presented to the client in the form of a presentation drawing, mostly in perspective rendering. Subsequently, measured drawings are made for the building partners for the benefit of the construction of the building. And finally, drawings can record existing buildings in a finished state. Before using architectural drawings in research, one has to know what kind of drawing it is and at what moment of the building process it was produced.
The architectural drawing itself can be considered a means to communicate aspects of buildings in different architectural projections, for instance, plans, elevations, roof plans, sections, perspectives, axonometrics and isometrics. In architectural practice, an architectural object is mostly represented by orthogonal projections: a plan, elevations, and sections. Orthogonal projections represent objects without optical distortion. Agreements are made on the way walls, doors, windows, and other elements are represented in drawings. Because of these conventions, one usually has to learn how to read them. In the architectural analysis of buildings, other kinds of visual material are added, such as reconstruction drawings involving (all) phases of a building, photographs, paintings, and drawings of details9. For the benefit of the restoration of buildings, drawings of the existing situation and the proposed changes (before-after) are common. As described in the previous chapter, in the framework of Protected Townscapes, a roofplan, a mass model with façade arrangement, and perspective drawings are added for defining the quality of the townscape in terms of façade characteristics and building heights.
Whereas the more technical, orthogonal representations in architecture (plan, elevations, sections) function to convey information as "facts", clients of architects usually base their decisions on the perspective projection. Contrary to orthogonal projections, which are more difficult to interpret because of their conventions, the perspective projection is closer to the human perception and therefore easier to understand and interpret. For instance, Gordon Cullen's Townscape contains nothing but perspectives as seen through the human eye (approximately 1.60 meters). He also presents walks through towns to grasp the fourth dimension (movement around a building) by means of a series of different viewpoints, which he calls serial vision10. In presentation drawings, buildings are also often represented in perspective in order to convey spatial information at a level understandable for many people.
In order to make a two- or three-dimensional representation, a detailed spatial analysis of the building needs to be made first. The building, as a mental image, must therefore be decomposed into geometrical primitives. During this process of decomposition, decisions can be made about which elements are important to be represented and which elements can be left out. Or, in the words of Mitchell: In a given context, the set of objects to which we can refer, and about which we can express comments, is the universe of discourse. In discourse about a building the universe invariably includes the parts of the building to which we choose to give attention. Different people may decompose a building into parts in different ways and so include different collections of parts in a universe of discourse11.
So, decomposition of the idea of a building into different parts is a subjective act, since each person makes different choices and each project values different elements or features. An unavoidable consequence of this process of abstraction is the loss of information12. Loss of information is, however, not always a negative consequence. Abstraction forces one to focus on the subject under study without being distracted by elements that are not relevant for a specific study. It allows one to ignore unnecessary details so that a selection of relevant elements, essential for carrying out a certain project, becomes apparent. When necessary, one can always consult the original sources, such as the building itself or photographs of it. If applied consistently, abstraction allows us to analyze different architectural objects in a uniform way, since all elements can be viewed at the same level of detail and at the same scale.
The fact that beautifully refurbished drawings had the effect of distracting the attention from the main structural appearance of a building was already recognized by Jean Nicolas Louis Durand in his Recueil et parallèle des edifices en tout genre anciens et modernes (1800)13. In this book he juxtaposed line-drawings of buildings of the same type. Though the drawings were not all at the same scale, they can be compared in form on the same level of detail, producing a catalogue of forms of each type. He wished to do away with all unnecessary extravagance and decoration in architecture14. In this way, he reduced architecture and its representation to its structural and formal geometry. As an engineer he was more in favor of technical, abstract line-drawings than the refurbished drawings which were acceptable at the time, such as watercolors from the Ecole des Beaux-Arts. Beaux-Arts representations mainly consisted of plans and elevations which were later lavishly rendered with shadows, colors, and decorative elements15. In Durands view, these refurbished drawings conceiled the essential geometry of forms and buildings would be represented more objectively by orthogonal line-drawings stripped from superfluous details.
As mentioned above, abstraction makes it possible to compare plans and elevations drawn on the same scale at the same level of detail. At the end of the 19th century, the notion of objective, abstract line drawings, as opposed to subjective perspective projections, led to the reintroduction of the axonometric projection16. The axonometric projection became popular after Auguste Choisy had illustrated his book Histoire de l'Architecture (1899) with axonometrics. The axonometrics provide information about both the three-dimensional structure, the plan, and the elevations of buildings: Graphic documents, sometimes simplified by the suppression of superfluous details are, for the most part, presented in axonometric projection, a system which has the clarity of the perspective and lends itself to direct measurement. ... The reader has under his eyes at one time, the plan, the exterior of the edifice, its section and its interior dispositions17. There are no optical distortions, parallel lines remain parallel until infinity. On the other hand, the drawing can be read in two ways: it can display the exterior seen from above, or the interior seen from below in the way Choisy did. Although this may be confusing, it was probably because of this that The Style and the Modern Movement made extensive use of the axonometric, since it conveyed several kinds of information in a single image18. However, a high viewpoint reduces the number of kinds of information, because the interior disposition and sections are no longer visible. Instead, it provides a clear image of the three-dimensional structure.
Similarities, regularities and differences in plans of historical buildings also become apparent in the easily comprehensible diagrams of Wittkower (schematized plans of eleven of Palladio's Villa's) and Frankl (diagrammatic plans of centralized churches, not on the same scale)19. These architectural historians believed that buildings can be compared on the same level when represented in a uniform way or drawn at the same scale. As discussed in the previous chapter, Fortier, and to some extent Secchi, made use of the axonometric projection, because it can communicate different aspects of the morphology of a (part of a) town.
In summary, different kinds of drawings can be distinguished in
architecture, each with its own conventions and level of
abstraction. When using architectural drawings as source material
in research, the purpose of a drawing and its conventions need
to be known. The fact that abstract line-drawings look more
technical, but are often more difficult to read than
(refurbished) perspectives, needs to be considered with respect
to the way the architectural development of the townscape of
Heusden is going to be visualized. The axonometric projection,
however, provides a way to display the whole town in a clear
image without optical distortion.
Computer-Aided Architectural Design
Computer-Aided Design (CAD) or, with respect to architecture, Computer-Aided Architectural Design (CAAD) has slowly made its way from the first applications in aeroplane design in the sixties into the architectural office. Here, CAAD is increasingly replacing the traditional drawing board. In architectural practice CAAD is still chiefly used by architects for producing measured drawings and sometimes presentation drawings with perspective renderings of the designed buildings and the site. Whereas CAAD is used in the architectural office to design for the future, CAAD can also be used as a drafting tool for drawing architectural objects which already exist. In architectural historical research, as in the present study, CAAD is used as a drafting tool20. Since there are many good books available describing the use and applications of CA(A)D, only a few of the very basic principles needed for understanding the choices made in the project are discussed here.
CAD can best be considered a graphical database in which the x, y and z-coordinates of graphical elements are stored. There are two main systems to model or construct two and three-dimensional computer models. On the one hand, in a surface modeler, three-dimensional objects are constructed by means of virtual surfaces without thickness. On the other hand, a solid modeler uses volumetric entities, such as cubes and blocks to construct models, thus constructing solid objects. Since we made use of a surface modeler, what is described below is based on that.
The user has geometrical primitives (lines, planes, cubes, blocks, cilinders, etc.) at his disposal to start building geometrical computer models. On these models 2D and 3D operations such as zooming, panning, scaling, translating, and rotating can be carried out. Existing ground plans can be digitized, i.e. the lines on the drawing can be traced with an electronic device or numerically, to input the information electronically. The electronic ground plans can hence serve as a basis for constructing three-dimensional models on it. One of the main advantages of the electronic drawing board is that repetitive elements can easily be copied. Elements and objects that belong together can be labeled as a group and, as such, can be moved, scaled, copied, translated, etc. Different kinds of architectural data, such as the site, the plan, the spatial structure, details, and vegetation, can be stored in separate layers. These layers can all be merged to form a complete model or (one of) the desired layers can be selected for other purposes.
In the present work, a model means a spatial model (computer-generated), rather than a conceptual model or conceptual framework. The difference between a physical model (made of cardboard, wood, stone, paper, etc.) and a computer model is that the physical model is tactile (it can be touched) and made on a certain scale, while a computer model consists of virtual lines, surfaces or solids, which suggest spatiality. It can also be given any required scale and can be viewed from any viewpoint.
Similar to making a drawing of a three-dimensional object by hand, for the construction of a three-dimensional computer model, one has to make a detailed spatial analysis first. Starting with simple basic geometry, shapes can be added until finally the desired form has been approached. Once a three-dimensional computer model has been constructed, any kind of projection (axonometric, isometric, perspective) from any angle can be chosen. The model can be displayed in wireframe, which shows all the lines of the object, including lines which, in reality, are hidden behind the solids. Wireframe views easily confound the viewer by the many crossing lines. The hidden-line removal option shows only the lines of edges of surfaces which can be seen from the chosen viewpoint, displaying the objects as volumes. This improves the suggestion of three-dimensionality. The model is even easier to read if the virtual surfaces of the model are shaded with color. The model can be viewed and evaluated from any viewpoint and changes of the viewpoint can easily be carried out. These can be time-saving operations compared to traditional drawing, since the computer calculates the values for every point in the model from the chosen viewpoint. So, several viewpoints can be selected for further elaboration, from which the best can be chosen for a presentation. In fact, the computer can be used as a laboratory in which alternative possibilities can be compared and evaluated21.
Several ways of electronic elaboration of CAD models are possible to enhance the idea of reality. While for the modeling almost any general-purpose CAD program can be used, the kind of elaboration needed depends on the purpose the model has to serve. The models can be rendered photo-realistically with color, shadow, and other special effects. Texture maps, i.e. bitmaps, which imitate, for instance, materials like brick or wallpaper, can be used as background image, but they can also be projected on three-dimensional objects in the CAD model to make the image look more realistic. The final results will often be further elaborated as two-dimensional images (bitmaps). By using an electronic paintbox, for example, it is possible to add explanatory text on the image. CAD models can be merged with video images or images captured by scanning. In this way one can speak of synthetic images which can in fact be very close to the refurbished drawings of the Ecole des Beaux-Arts22.
This general description is the basis of the implementation of CAD in our case study, which will be assessed in the following sections. Computer models can look as technical as an engineer's line drawings, but with more efford, they can also be made to look as photo-realistic as required. The more powerful the CAD configuration, the more realistic and larger the models can be. However, this would not affect the method used. We therefore have to find a way to visualize only those elements of the town that we have chosen to pay attention to, so that the individual elements can be compared in a uniform way.
Computerization of Architectural History
Some recent applications are discussed in this sub-section which all deal with aspects which can be relevant for our study and visualization of the town of Heusden. In this sense the focus is not only on the visualization of the single building, but especially on larger parts of the city, or the townscape. Examples from the field of education and teaching, reconstruction and presentation are described here.
More and more architectural firms produce presentations of proposed buildings visualized in their future surroundings by means of computer visualizations. In concept and realization, these visualizations are not much different from the physical scale model which they usually replace. If architects use CAD for their presentations, they aim to present their new buildings in as detailed and as photorealistic a way as possible23. In these visualizations, the buildings in the immediate vicinity of the new building are mostly modeled at a very abstract level of detail. They are usually not more than geometrical primitives, such as blocks, cubes, and cilinders. In this way, the new building, which is represented in detail, stands out clearly in its context.
The first computer models of complete cities, such as, for instance, the computer model of Glasgow and its university, were modeled in the same way. Simple three-dimensional shapes could be displayed in hidden-line or colored and shaded, while, in hilly areas, the cityscape could be merged with a spatial computer model of the terrain. Details such as windows and doors could be drawn as line-elements on the surfaces of the model or modeled three-dimensionally. Each building was stored in a database. The model could thus be used as an electronic urban database24.
In the urban planning process of evaluating the aesthetic qualities of a new building in the townscape with respect to proportions and scale, these simple geometrical models appear very effective. Especially, the possibility to make animations of these urban models in which one can walk through the streets at eye-level and at walking speed, or fly over the town provides a way to survey the morphology of the urban environment. In fact, an animated walk through a town is nothing more than the computerized and intensified version of Cullen's serial vision25.
The same techniques of animation are used in evaluating landscape architecture. Here, video images of the existing situation can be merged with proposed buildings, while new landscape elements such as trees and bushes can be inserted in the computer photo-montage. Techniques of merging video images with CAD models can in this way improve decision-making in design and evaluation of landscape architecture26.
With a head-mounted display device and datagloves which react to movement of the head and the fingers respectively, it is possible to explore real-time (simultaneously with the movement of the head and fingers) the spatial qualities and characteristics of virtual space. In this way, one gets the impression of walking physically through the space suggested by a three-dimensional computer model. Objects can be picked up and moved. This interactive scene walk-through is called Virtual Reality27.
Some very interesting experiments have recently been carried out to teach students the history of architecture by having them reconstruct ideal-typical cities from the history of architecture using CAD. The architectural development of the imaginary Greek city of Xara reconstructed in the Greek period, the Roman period, the Gothic period and the Baroque period, etc. The purpose was that the students would grasp the idea of a certain kind of city by actively reconstructing it, basing themselves on literature and conventions in architecture at a certain time and place. Each student was assigned a part of the city to complete with imaginary buildings in the appropriate style. The teachers had chosen to use the minimal level of detail needed, so that it would look like a city open to new explorations and transformations28. The purpose of this approach to teaching is twofold: students of architecture learn something about the history of architecture and get used to drawing with CAD at the same time. Even though, in general, too much time was spent on learning to operate the tool and not enough on actually using it29, it certainly proved a good way to study architecture, since the very act of drawing, whether by hand or by using CAD, forces one to examine the subject intensively.
In order to be able to make a graphical representation, one is forced to analyze an architectural object in terms of its three-dimensional structure30. Since all possible perspective views and projections can be generated by the computer, the architect or architectural historian does not need to be a skilled draftsman. This is an advantage for the architectural historian, who is usually not trained to produce architectural drawings. Even if he is, it is difficult to construct axonometric, isometric or perspective views manually. Although an architectural historian still has to learn how to input three-dimensional structures into the computer, once he has achieved this, the building can be viewed from any possible viewpoint. This is an advantage when, for example, original designs are compared with old photographs of a building from the same viewpoint (morphological verification). For instance, comparison and verification of existing buildings or architectural elements by means of two-dimensional overlay techniques could explain underlying morphological issues. An example of this approach from the history of architecture is the comparison between existing buildings and the architectural treatises on which these buildings are based31. The same method can be used for the verification of the morphological reliability of old maps, as will be described in Chapter III.
The computer can also help to verify the reliability or conventions of depicted perspective projections. An example of this is a study of the perspective in Leonardo da Vinci's Last Supper. The room where the fresco is situated (a refectorium) was reconstructed in a three-dimensional computer model. A scanned image of the fresco was placed into the computer model. By changing the angle from which the fresco was seen, the originally intended vantage points were detected. It appeared that Da Vinci had intended two (rather than one) optimal viewpoints: one at the entrance and one from tables along the wall in the refectorium. Extensive research had already been done to the perspective in the fresco, but, none of those studies had been able to produce a plausible explanation, whereas with the aid of computer graphics a very plausible interpretation could be given indeed32.
The problem of computability of history33 with respect to research into existing architecture and cities has hardly been touched upon in historical architecture. Real architecture or cities never exist in an ideal, absolute form, or in one style only. As pointed out in Chapter I, a city is always a synthesis of different architectural periods, a collage of different forms and styles which have come down to us through the ages. To study the transformation of the architecture of an existing city means to work with imperfect, heterogeneous and often incomplete material. The following (fairly recent) examples show that the existing or lost city increasingly attracts the attention of archaeologists, architects and architectural historians. In addition, historical information systems and multimedia systems which are able to manage and integrate different kinds of visual sources (photographs, text, digitized maps, plans, elevations, and sections) as well as computer models, animations and video are becoming increasingly important.
Multimedia environments can be very useful for educational purposes, though the information is usually pre-defined in a certain way. Although many more applications are currently being developed, we limit ourselves here to only mentioning a few examples. The exhibition of the archaeological research of Pompeii (1990-1992), showed, apart from the exhibits, an interactive computer system which allowed each visitor to follow his own path through the information, both visually and textually, or to explore a specific subject in-depth, such as the House of the Vetii, images on walls, or the Stabian Baths. For all this, an enormous amount of information was stored in a gigantic database system34.
At another exhibition in 1991, called the Multimedia
Presentation of Robert Adam's Work, detailed models of
Adam's buildings were inserted into a three-dimensional mass-computer model of Glasgow. Via an interface, the visitors of the
exhibition could interactively choose to investigate aspects of
Robert Adam's life and works of architecture35.
The Multimedia exploration of Split (1992) proved
somewhat more useful for historical research, because not only
visual databases for specified objects could be retrieved, but it was also possible to carry out visual comparisons36.
Another example of the use of several kinds of information, is a historical urban information system, in which historical cartographic material, digitized and stored in a Geographical Information System (GIS), is combined with databases about construction, architects, owners and other people involved, literature and documents37. With such a historical information system, much more information can be made available to, for instance, planners or local councils to be used for new projects, preservation, and restoration38.
There are many examples of computer-assisted reconstructions of individual buildings, mostly famous buildings from the history of architecture and works of architecture by modern architects in particular, the latter probably because these buildings are conveniently devoid of intricate detail39. Some very interesting projects have been carried out by historians, architects or archeologists in the reconstruction of (partly) lost or destroyed building complexes or towns40. For instance, after architectural research, a reconstruction has been made of the town of Messina, representing the town at the end of the 19th century before it was destroyed by an earthquake in 1908. In the reconstruction every detail (windows, doors, glazing bars) was constructed in three dimensions41. The many three-dimensional elements required so much computer memory that only a small part of the area could be completed: the market place surrounded by ten detailed buildings.
The reconstruction of Cluny III (12th century) in Paris which was almost completely destroyed in the French Revolution, is an example of detailed historical research of documents and using the results of excavations for the creation of the computer model42. Many details, such as the vaults, the shafts, and the windows, were all modeled in three dimensions. An interesting point is the fact that the computer did not manage to connect one of the walls to the ceiling. After some research it was discovered that the surveyor had overlooked a step which explained the missing height of 30 centimeters in the drawings that were used for the computer reconstruction.
In most of the above-mentioned cases the interest seems to be directed at the main geometrical structure and wall openings. No wall textures or materials are used, nor do the models reveal - except for Cluny III - how the buildings were constructed. All of these projects have reconstructed only one special phase, not a development over time. Most of these projects were carried out with powerful equipment.
It should be noted that many of these applications, except for the perspective verifications, can in principle be carried out manually, though that would probably take a lot more work. In this respect, one traditional example needs to be mentioned in particular, in which the development over time of a city was visualized by hand drawings. In Die Gestalt der Deutschen Stadt, Karl Gruber describes - besides giving some reconstructions of real cities, all lavishly illustrated by drawings - the physical development of the average German city43. Illustrated by several perspective drawings, he drew the development of an ideal-typical German city such as a typical cathedral city, abbey city, or merchant city. It is clear that any of those cities could have been developed in a different way than Gruber wanted us to believe. The drawings suggest that for the ideal city at any time and place alternative images could have been possible. Most interesting in this sense are Gruber's drawings in which he shows the development over time of a city (1250 (Romanesque); 1350 (Gothic); 1550 (Renaissance); 1750 (Baroque). Gruber must have analyzed the required level of detail for every single drawing and the typical urban elements for every period of time. This example serves to illustrate that with skill and dedication and indeed time, any kind of drawing can be carried out manually. The use of the computer, however, accelerates the process and is much more flexible in executing calculations for changes or generating new viewpoints. Besides this, using CAD as a database, many elements are labeled or can be stored separately in element-libraries from where they can be retrieved at any time.
Evaluation
As far as presentation is concerned, by means of virtual reality and animations, or animated walk through, one can experience future or lost (Cluny III, Messina) buildings and cityscapes. Furthermore, it appears important for the researcher to carry out the drawing or modeling work himself, since the act of making reconstructions of buildings requires that one looks intensely to the object to be drawn, in order to get a better understanding of the complexity of the structure. Though the present study does not intend to produce an interactive multimedia environment, it will be worthwile keeping the possibilities provided by it (i.e. the linking of graphical information with historical databases) in mind for future implementation.
After having learnt from other projects dealing with CAD and architecture, we then needed to establish our own methods and techniques for the project. In order to get acquainted with constructing a relatively large three-dimensional model of a town, the Development Plan of Heusden (1965) was selected to be visualized in three dimensions. The Development Plan, which represented the building envelope for further developments, represented the choices at the time in urban management.
It was also necessary to know how detailed the models should be with respect to the constraints of computer memory and what the minimal level of detail needed for the project was, so that features would still be recognizable, both from close by and from a distance. Furthermore, the most effective way had to be found to present the transformation of architectural objects over time. This was tested in the computer model of Vismarkt (Fishmarket).
Both pilot projects were carried out without extensive architectural historical research. Only available material was used. In the present section the used techniques are only globally discussed, since the next section (2.4) deals with the construction of the computer models and the decisions with regard to limitations in detail. The computer systems used will also be explained later. Here, we limit ourselves to mentioning the very basic techniques used for carrying out the pilot studies.
Development Plan Heusden Stad 1965, A. Peetoom.
The three-dimensional visualization of the Development Plan 1965
Crucial for Heusden's townscape after 1965 was the above-mentioned Development Plan Heusden Stad 1965. The drafting of the Development Plan was commissioned by local government of Heusden to architect D. Zuiderhoek and his assistant A. Peetoom44. Peetoom designed the Development Plan and wrote an Explanation to accompany it45. The Development Plan is a situational plan and though the accompanying Explanation contains several elevations and some perspectives, it was not entirely clear to us what the intentions of the Plan would mean for the three-dimensional morphology of the town. The architect did in fact make an oblique projection of what the town would look like according to the Development Plan. But, the oblique projection displays the town only from one static viewpoint, which is close to the one taken by Blaeu's map of 1649, and it mainly concentrates on the area bounded by Putterstraat, Burchtterrein and the waterfront. We therefore decided to visualize the Plan's information in a three-dimensional computer model, which would give us an idea of what it was like to construct a relatively large model. Furthermore, the visualization could later be compared with the real townscape as it exists now.
The Development Plan consists of a two-dimensional plan of Heusden (1:1000) and an Explanation. Functions are marked in the Plan by different colors of the parcels, while every parcel has a number. This number corresponds with a list next to the plan. In the list, information about the height, depth and width of almost every building (400) can be found as well as function codes and the number of floors. This detailed information about each house enabled us to build a three-dimensional computer model. Since we could not find a complete roof-plan (except for some partial plans), aerial photographs were needed for information about the direction of the roofs and the types of roofs (hipped, saddleback, pointed, etc.).
First of all, the main layout of the plan was constructed in the computer by digitizing the street plan of the Development Plan. The focus was on the city-center which was both the oldest and visually the most interesting part. This area was bounded by the Catharijne Church, Putterstraat, Burchtterrein and the waterfront. The rest of the town on both sides of the town canal was represented by simple rows of houses. The fortifications were indicated by a single wall, marking off the area under study. Only buildings ranging with the streets were represented (as in Peetoom's oblique projection), while buildings within the blocks and along alleys were omitted. One by one the dimensions of each building inside the building blocks were entered.
Though the list did not provide information about the public monuments (Catharijne Church, Town Hall, Fishmarket Hall), even though they were present in the oblique projection, these were visualized all the same - albeit in a very abstract way - because the city is very much characterized by them.
Hidden-line computer image of the 1965 Development Plan.
The resulting simple mass computer model can serve to analyze the scales, proportions and heights of the buildings. Since the Development Plan can be understood as the building envelope for further developments, the intentions represented in it should be examined. For instance, the model shows us that the delicate structure of the town should be preserved and that scaling-up of the width or height was not allowed. It even appears that it was intended to replace some multi-storey buildings which had been built at the end of the fifties, by lower, more traditional types of houses with pointed or hipped roofs which meant a scaling-down.
During the construction of the computer model, it turned out that a small error had been made in the description of one of the houses on Ridderstraat. The description said that it was to be 16 meters high, while the adjacent houses were described as being 3 and 6 meters high respectively. The computer model is ruthless in showing this kind of error, especially in the relatively delicate structure of Heusden. Although there are a few buildings of 16 meters high or more, it is not likely that this house was indeed planned to be 16 meters high. When the plan was drafted there were no buildings at the said location. A new building inserted at that place could therefore not have been planned at that height. All the more so, because the Development Plan did not involve the scaling-up of buildings. On the oblique projection by Peetoom there is no sign of a high building either. On the contrary, the building in question is very low. Like the Cluny III example, computer visualizations can easily detect small errors in drawings or descriptions.
It is not by coincidence that for his oblique projection Peetoom chose almost the same viewpoint as Joan Blaeu did in his famous map of 1649. The Mayor of Heusden at the time, G.M. Scholten (1966-1976) often stated that the whole restoration of Heusden was based on the town structure as it can be seen in the map by Blaeu46. The visualization of the Development Plan 1965 could thus serve as a basis to examine whether, in reality, the buildings and restorations were carried out in accordance with its regulations, and to what extent the Plan was really based on the map by Blaeu. This will be described in Chapters IV and V.
The computer model of Vismarkt (Fishmarket)
To be able to study the level of detail and abstraction needed for the Heusden project it was decided to carry out experiments on some houses at Vismarkt. The main reason for choosing the group of houses in question (Vismarkt 14, 12, 12a) was its central location, the availability of information about these houses and the possibility to test an urban block with some of the houses in detail. We needed to know what the minimum amount of information was to be able to recognize and analyze the façades from both close by and farther away.
Houses at Vismarkt, drawing by Ferd. B. Jantzen 1943.
On the basis of drawings of the façades by Ferd. B. Jantzen (1943) and other visual material from the second half of this century dealing with the selected houses (i.e., photographs from different years), restoration designs from architect Peetoom, and plans, the models were constructed. Information from these various graphical sources had to be selected and integrated into a single computer model. For this study the relevant information consisted of the dimensions of the houses (volumes), the façade characteristics (type of roof and shape of gable) and details such as the door, windows and ornaments. The visual sources were ordered chronologically. Each separate source revealed aspects relevant for building the computer models and defining the transformation. For this test a simple polygon (surface) modeler was used that involved the option of time-coordinates47. With time-coordinates it is possible to show the changing form of a building or townscape over a certain period of time. Every phase is stored with a code indicating its chronological beginning and end, while the whole development is stored in a single file. Since houses and architectural details do not change all at the same time, but rather one after the other, there were different time-phases for every architectural object. Once the first time-phase (or time-layer) for an architectural object had been constructed, it was given a time-code 1. In the same file the façades were changed according to later modifications and given a new time-code. Since the computer can display only one time-phase simultaneously, all models were stored in a single file. In principle, each file can contain an indefinite number of layers-of-time. Running the file from Time 1 to End shows an image-by-image animation of the development of the objects. This option seemed perfect for our project in showing the development of the masses of the houses and their façades on Vismarkt over time.
For the first year (1943), part of a ground plan from that year was used, from which the outline of the building block was digitized as well as the individual plots. Then the houses were built three-dimensionally on the plots in the computer by means of virtual surfaces. Windows, doors and other elements, as they could be seen on the 1943 drawings, were drawn as line elements on the elevations (surfaces) of the model. The level of detail was based on the 1943 drawings. The computer images therefore remain in fact very close to the architectural drawings of Jantzen. With respect to computer memory it was important to be very economical in constructing 3-D elements. The corner house, for instance, consists mainly of four walls and a saddle roof. Unfortunately, the stepped gable had to be built in three dimensions (instead of a shaped vertical plane), which consumed quite a lot of extra memory. While building the model, every phase was stored with a time-code, starting with the first phase, i.e., the year 1943. Based on the visual material, the changes (repairs, restoration, demolition) made in the following decades were entered in the same file, defining the new time-code for each architectural object in each period.
The period 1943-1990 showed four different phases of development. Thanks to the time-coordinates, the development over time could be viewed in sequences, like a film. The problem of the use of sequences is, however, that when viewing the third phase, one has already forgotten what the first and the second phase looked like. In order to study the images in a way that is easier to interpret, the phases had to be juxtaposed. Juxtaposition of the four phases shows the phases 1943, 1965, 1976, 1990.
In the first phase (1943), the corner house, which was originally built at the beginning of the 17th century, is shown with a stepped gable, the lower façade of which (c.1850) has sash windows48. The smaller and lower house on the right was built around 1700. Next to it, on the right, we see a very small house with a flat roof, dating from c.1850 and a gate leading to the gardens behind the houses. In the second phase (1965), the small house (1850) was demolished. The gate was widened to take its place. During the restoration of Heusden (1965-1990), the corner house was one of the first buildings to be restored (Peetoom)49. In the third phase, we see that the front has been radically restored to its original 17th-century appearance, based on traces in the building50. The restoration was based on the results of detailed research of the building construction. The sash windows at the front were replaced by a reconstructed wooden penthouse construction of five bays wide with the door in the middle. The windows above the penthouse show a small division, but below the penthouse there are single panes of glass for showing products. Cross windows with shutters have been restored on the first and second floors. High up in the front a very small cloister window has been added. Except for the part of the penthouse that goes round the corner, the side-façade facing Vismarkt has not radically changed. The windows (2x3) in the side-façade have been retained but the windows of the house on the right now also have panes with division (4x2+2).
In the last phase, we see that the gate has been replaced by a new house of three bays wide closing the street wall (architect Verlaan & Bouwstra). This took place in 1985. Like the adjacent houses, it has the ridge parallel to Vismarkt. With respect to scale, this house has been consciously adapted to the existing structure while the new brick and large window openings show that it is obviously a new building. With the exception of one part of the side-façade of the corner house, almost every trace from the 19th century has been erased. The small house has been demolished, the façade of the corner house has been radically reconstructed and the 19th-century windows of the house on the right have been made to look old by a division into small lights.
When viewing the houses from close by, the applied level of detail of the computer drawings appeared sufficient to understand the transformation of the houses. However, when the model of the block was seen from a distance, the lines tended to merge. In fact, application of two levels of abstraction would solve this problem: one model with minimal details (or none at all) which can be viewed from a distance, and one detailed model which can be viewed from close by.
It was only after the four phases had been finished that a mistake regarding the interpretation of the drawings became apparent. It appeared that the lower front of the corner house had not been reconstructed symmetrically with five bays as can be seen on the computer image, but it was carried out a-symmetrically with only four bays with the door in the third bay. The drawing which was used for building the computer model appeared to have been an unrealized design. All the more reason to be very careful with the interpretation of visual material.
Apart from this, the results were fairly satisfying. However, drawing all the details accurately on the surfaces of the elevations required much time and computer memory. However, for small, less detailed projects the time-coordinates would be very useful. In the case of Heusden, the model of the city would have to be broken into many small pieces. To deal with the whole or the greatest part of Heusden would require at least 25 pieces. More important was the fact that changing the details on the façades proved not to be as easy as it looked. Another set-back of this method was that the renderer in which the different parts of the model were merged and colored (cf. the Development Plan in the previous sub-section) could not display the line-details. Since façade details were considered important in the project, another solution had to be considered.
The visualization of the Development Plan demonstrated that a three-dimensional model makes the structure of the townscape immediately comprehensible to the viewer and it even can reveal small errors or incongruities. Colors can be used to emphasize specific elements, or to distinguish functions or buildings from different periods of time, or themes. Functional use of colors can thus be compared to thematic cartography.
At first sight, the option of the so-called time-coordinates in the Vismarkt project appeared very useful for the visualization of the development over time. However, within the present limitations of the hardware they cannot be used. With respect to the visualization of the details on the houses, two levels of abstraction seem to be needed: one for the complete town model and one (with more details) to be viewed from close-by. The level of detail needed for the view from close-by can be just a little less detailed than the line details in Jantzen's drawings.
2.4 Methods and Techniques Used
Basing ourselves on the experiences of the above-mentioned pilot-projects, we planned the project in different stages, starting with the data-acquisition, followed by the ordering and selection of data, the definition of the level(s) of abstraction to be used in the computer models, finding ways to present the models, and create the models. This section describes the methods and visualization techniques which were chosen for the study.
In the light of the decision to study the changing appearance of Heusden's townscape by means of visual material, town plans, and cartographic material, and in the light of the possibilities in CAAD as the applications from the first section have shown, we needed to find a method to build three-dimensional computer models representing this changing image of the city.
First of all, we needed to know what material was available, hence an inventarization was carried out. The available material was subsequently separated into basic material (i.e., material with reliable measurements) and additional material (i.e., material which helped defining the structure and appearance). Based on the starting points of the project, the material was ordered in a way useful for the construction of the computer models. A method was chosen to build the models, and decisions were taken with regard to the level of detail needed for various purposes.
We started collecting visual material from the 20th century needed for the construction of the computer models 1900-1990. Simultaneously, historical maps, fortification plans, and other visual material was collected for defining the urban development previous to 1900. Since the historical material previous to 1900 will be dealt with in the following chapter it is not discussed here.
The series of measured drawings produced during the Second World War (1943) by Ferd. B. Jantzen c.s. within the framework of an Investigation of Dutch Urban Beauty appeared to be most important51. This survey is recorded in situation plans, indicating the plots, the buildings which originate from the 16th, 17th, 18th, 19th and 20th centuries, and a house-number map. In a complete set of detailed drawings 1:100, the dimensions (in centimeters) of almost every single house, their functions, and the direction of the ridges are recorded. Besides this series of drawings, complete street walls are drafted 1:100. Some of the richer façades are drawn on separate sheets of paper 1:50. The assignment explicitely states that the buildings should be drawn soberly, without pictorial effect, without shadow and rendering52. Consequently, the drawings display the buildings in simple line-drawings, the contours of the buildings, windows and doors, and, incidentally, some details in straight, thin black lines. The drawings by Jantzen of the existing façades of 1943 formed a perfect basis for tracing the history back to 1900 and they could be used as a point of reference for later changes. They were also intensively used for the restoration by architect A. Peetoom53. In addition, we used many detailed plans, drawings, and sketches from Peetoom's own extensive restoration archive.
We also needed cadastral maps with accurate measurements, especially the one of Heusden dating from 1832. Aerial photographs were required for defining the type and direction of roofs, and any material from which visual information could be derived about the façades and the other elevations54. These, as well as other plans, photographs, pictures, prints, drawings, sketches, postcards, etc., which showed what buildings looked like at a certain period of time were collected and ordered chronologically. It turned out that from the year 1900 no town plan could be found. We therefore had to rely partly on older maps (the cadastral map 1832 and the River Map 1854) and later maps (1943) and images on photos and postcards. Important in this sense were the many postcards and photographs from around the turn of the century. These photographs also played an important role for the architects during the restoration period 1965-1990.
As was already discussed in the first section, the interpretation of the visual sources, other than the buildings themselves, is one of the main problems in architectural history. Historical drawings, maps, and designs, however, are not always reliable. They are often adaptations or idealizations and they may differ from the built reality, as we have seen in the Vismarkt project, because changes were made during the building process. So, the reliability of drawings and town plans and the conventions of depiction used in them have to be carefully analyzed before any information can be extracted from them.
The best way to prove the reliability of town plans and (old)
maps is to make photographic projections from the old map and a
recent one on the same scale55. Then the two maps can be
projected together as transparant overlays. This can, of course,
be done by means of photocopies, but it is much easier to achieve
by means of two-dimensional computer models. After a computer
model has been made of each map, the models can easily be re-scaled, and the computer calculates the new value for every point
on the map. By taking a common point for both maps, it is
possible to scale the models, translate them or rotate them to
the point that they fit best, provided that the x-, and y-values
preserve their relative dimensions. In this way, the lay-out and
structure of old town plans can easily be compared with
accurately measured town plans.
For the present study, the basic ground plan is the cadastral map
from 1832, supplemented with various townplans from the 20th
century. The most important series of drawings are the plans and
street wall surveys by Jantzen c.s. (1943), which are used as a
basis, and plans and measured drawings for the restoration by
Peetoom (1965 and later). Topographic maps and other visual material (photographs, engravings, views, etc.) were used as
additional visual material.
For visual display of the transformation of a town in representative intervals, the data had to be organized chronologically. In order to analyze the 20th-century developments, three-dimensional computer models represent significant reference dates: 1900, 1943, 1946, 1965, 1975, 1990.
The year 1900 was chosen for the first reference date because at that time the old town-harbor was still intact. It disappeared in 1904, when the new estuary was dug. The second reference date is signified by the drawings of Ferd. B. Jantzen c.s., delineated in 1943, showing the town a year before it was badly damaged during the end of the Second World War. With respect to the third reference date, 1946, the model shows the open spaces left by destroyed buildings. After the end of the war, a comprehensive reconstruction program was set up. The fourth reference date, 1965, marks the end of the reconstruction period and the introduction of a new plan: the Development Plan or Restoration Plan, which involved almost every house in Heusden. The reference date 1975 shows the impact of the restoration on the townscape halfway (European Architectural Heritage Year), while the year 1990 was chosen to show the result after the restoration campaign had been finished.
Besides the fact that buildings in Heusden are mostly indicated by means of street-and-house numbers in official documents, the use of the land registry number (Ordnance Survey) for buildings is also common. In the case of Heusden it turns out to be more complicated. Next to the two usages indicated above, in Heusden (and some other towns), between c.1850 and 1950, buildings were also indicated by means of a neighborhood system or, like in Heusden, a quadrant system. In the quadrant system each building was assigned an East-, West-, North- or South-indication with a number. So, there were three different systems in documents and records for indicating a building in the 20th century: the land registry number, the quadrant system and the street-and-house number. The land registry numbers turned out to be difficult to trace since plots had often been subdivided when more houses were built on the same plot. Lists of building licenses issued between 1947-1990 were organized by house-and-street number or by owner. Only a few licenses had been issued based on the land registry numbers. Though street-and-house numbers had sometimes changed in the past (some streets were renamed more than once), most of the houses could be identified with the present numbering and with the help of pictures56.
Since important changes of a building can best be seen in the façades, the façades in the oldest part of town, i.e. the area bounded by Putterstraat, Burchtterrein and the waterfront, were visualized in detail. More detailed visual information would exceed the limits of the available computer memory when the different parts were merged. The delimitation was also based on Jantzen's 1943 drawings, with the exception of Wittebroodstraat, Sterrestraat, and Oudheusdensestraat, which were left out because they are situated outside the above-mentioned area. This resulted in a test-set of about 300 buildings.
Each house within the oldest part of town was carefully studied as far as its changing appearance is concerned at each of the above-mentioned reference dates (1900; 1943; 1946; 1965; 1975; 1990). The results were recorded in data-schemes. In the data-schemes (a kind of compiled index cards with diagrammatic images and text) different kinds of information are accumulated. Along the horizontal axis the houses are arranged by street-and-house number while in six vertical layers a schematic drawing of the house's appearance in each of the six periods is displayed.
The data-schemes further provide information about:
- the appearance of each building in a schematic drawing in each
of the six periods
- the exact dimensions of the façades (height and
width)
- the original year of construction (according to the 1943
drawings)
- known restorations of the façade
- the year building licenses were issued
- the architects (if known)
- whether it is a listed building
- whether the building is considered important for the
townscape.
Better than any visual database available at the time, the data-schemes could be used as a reference. They proved invaluable when the models were constructed. Summarizing, the material was first ordered in data-schemes by means of street-and-house number and then chronologically. In addition, historical maps and plans previous to 1900, to be discussed in Chapter III, were ordered chronologically.
The construction of the computer models of Heusden
At this point we need to recall our starting points. The focus is mainly on the exterior characteristics which can be seen from the street. This means that the three-dimensional computer models show only the exterior of the houses which bound the blocks. The buildings within the blocks are not visualized in the computer model nor are the backs. One of the characteristics of Dutch town houses are the pitched roofs, elements which are fundamental in the visualization in the computermodels as well. In this way, the models are somewhat more detailed than pure block-like structures.
Since the computer models are research models, photo-realistic rendering is not necessary. Rebuilding the urban environment exactly the way it already exists would not serve the purpose of the project. Here, computer visualization is rather used for gaining extra insight. The research models are visualizations of the exterior only, and do not provide information about the interior, the building construction (inclined walls), or the building materials. Rendering of the computer models has been used to a limited extent for coloring different elements and for displaying the façades. Later, some texture maps which suggested water, grass, trees, and pavement, were added. All these limitations are necessary in order to be able to focus on the real research purposes: the analysis of the spatial transformation (plan, volumes, appearance). The purpose of abstract visualizations is to gain extra insight by making patterns apparent. Abstraction can even be an advantage, as has been pointed out in the previous section. In comparing many buildings, plans or façades, uniform - abstracted - images are necessary. Correspondences and differences become more easily distinguishable. In fact, a typology can be created in this way.
As has appeared from the data-acquisition for the projects, the architectural historian makes use of various kinds of material, which is often incomplete. Information extracted from the sources can therefore best be standardized. The required information needs to be extracted from the various visual sources and it needs to be integrated in a uniform way. CAD-techniques can be very helpful in integrating the extracted visual information about an architectural object in a uniform way in a single CAD-model. In this way, the visual sources are not only closely examined, but a new (computer) image is created in which the required information for the project is integrated.
The Vismarkt experience has shown that the level of detail is strongly dependent on what purpose the computer model has to serve. The distance from which the model is to be viewed is a determinant of how detailed the model must be. When one is analyzing a spatial structure of a complete town, details do not always have to be displayed. When displaying a small block of houses, however, details do need to be visualized in the model. Decisions concerning data input are therefore very important and also strictly define the subject under examination. One also has to keep in mind that the desired visual results must always justify the time spent obtaining them.
- Ground plan and volumes
The ground plans, which record the town in a certain period, together with the restoration drawings, served as the source for the dimensions of the plots and the ground plans of the houses. In those cases that restoration drawings were not available, the width of the façades was deduced from the 1943 drawings by Jantzen, or it was approximated from the 1:1000 town plans. Dimensions of the heights of houses could be derived by counting the layers of brick or by studying the relative differences in height with the measured adjacent buildings.
One of the first steps we had to take then is digitizing town plans of the six reference dates. These town plans were compared by means of projections in different colors (or line-types) in the same way as will be discussed in Chapter III. A digital image of a two-dimensional street plan can be obtained by digitizing (tracing the lines of the plan with a lightpen or mouse), or by numeric input of coordinates. When an A0 digitizer is not available, the original plan can be overlayed with transparant millimeter tracing paper, after which every single coordinate must be defined and entered into the CAD system. Another method involves scanning the map after which the lines must be vectorized58. Some towns in The Netherlands already have digital cadastral maps (Utrecht, Rotterdam, Maastricht, among others). Unfortunately, there is no such digitized plan available for Heusden. As a consequence, the existing plans of Heusden first needed to be digitized by input of coordinates.
Once the coordinates of the corners of the ground plan had been defined and digitized, the walls were given height in the models by means of virtual surfaces. The houses were directly modeled in three dimensions. Most roofs are saddleback and hipped, the two sides of the roof dividing the ground plan in two. This means, that our ground plan thus created, also resembles a roof plan, since not only the contours of the houses can be seen in it but the directions and kinds of roofs as well.
Although it was intended to model the relief of the terrain as well, this plan had to be abandoned due to lack of time. Besides, the choice of PC systems that could handle this was very limited. The landscape was modeled at a very abstract level. Except for the water level and the fortifications, the relief of the terrain was not modeled and, as a consequence, all the houses were modeled on the same level. Though the terrain in Heusden is generally flat, the subtle differences in the height of the terrain could contain important information about the historical development. This is, for example, the case with Vismarkt which is a little higher than Botermarkt and Hoogstraat because it used to serve as a retaining wall59. However important this fact is, merging a three-dimensional model with an accurately modeled landscape would have taken far too much time and didn't play any important role in the decision making process in the period under study.
- Façades
There are several ways to display façade details. The first manner is to model every window, door or minor projecting element in three dimensions. This method is probably the most realistic method, but, as we have seen in the Messina project, it is only useful for very small projects (e.g., a single house), since it needs a lot of computer memory. To draw details simply as line elements on the surfaces of the elevations of the model is much easier even though the idea of three-dimensionality is lost. The advantage of drawing on the surfaces is that the level of detail of the computer model will be relatively close to the conventional architectural elevation drawing. The Vismarkt experience, however, has shown the drawbacks of this method for our study: changing the details was not easy and the renderer could not display the line-details.
In the course of the project, a third way of displaying details was discovered. Façades and detailing can be painted with an electronic paintbox, or images can be captured by scanning. These texture maps or textures can subsequently be connected with the surfaces of the three-dimensional models. Changing the textures was easy by replacing one texture by another. Scanned images (digital photographs) from the façades are closest to reality. However, they also contain a lot of unnecessary or irrelevant information for the project. Eventually, it was decided to paint the images for the façades in a standardized way because then we could determine the same level of detail for all the textures, and irrelevant information could be left out.
Based on the detailed drawings by Jantzen, a texture map was painted for each façade in 1943. Additional texture maps were painted which show the changes of the façades in other years. The information recorded in the data-schemes proved very useful here. A black and white palette was used to paint the textures in which different shades symbolize the details of the façades. In this way, a consistent system was developed for representing features such as windows, doors, etc., in a standardized way. Black lines are used for the contours of the windows, just as in the drawings by Jantzen. The windowsills are dark, the windows themselves light. Glazing bars and mullions are represented black as well. In fact most colors are reversed. Black is the color for making the contours of features apparent, while other grey scales are merely supportive colors for the benefit of contrast. The textures are very close to Jantzen's drawings but just a little less detailed, as was decided after the Vismarkt project.
All texture maps have been painted in upright position at the resolution of 320x200 lines60. In order to be able to enter as much detail as possible, the façades which are 10 meters high or less, have been painted at the scale 1:5 (1 pixel = 5 centimeters). This is the case with most façades. In the model they are re-scaled x 0.5. Façades higher than 10 meters (stepped, shaped gables, etc.) have been painted 1:10 (1 pixel = 10 centimeters) and are re-scaled x 1.0 in the model61. As a consequence, these higher façades are less detailed and there is more loss of information. However, this is not always very apparent since much suggestion can be reached on pixel level. Because this project deals with the visualization of architecture for a specific purpose rather than the creation of measured drawings or photorealistic renderings, this level of abstraction is centainly acceptable.
The textures are connected with rectangular surfaces. In order to display the specific shapes of gables, such as stepped or scrolled gables, the areas of the rectangle that are not used by the texture are rendered transparant. This is also a simple way to display open porches or open doors in the façade.
In order to emphasize certain aspects, features can be deliberately exaggerated in size or given distinctive or contrasting colors. As we concluded after the visualization of the Development Plan, the use of functional colors approaches the concept of thematic cartography. To study the extent to which parts of the town have changed in color and texture after the restoration62, a distinction can still be made in the models between houses which leave the brick visible and houses that are plastered or painted. The first category is displayed in grey while the plastered and painted houses are white in the computer images.
Another issue should be explained here. The volumes of the houses are modeled as simply as possible in order to be able to enhance recognition and reduce the computer storage space needed to a minimum. Dormers, chimneys, porches, and other three-dimensional objects are therefore absent in the computer models. An excuse for these limitations is that these elements, though in principle subject to the regulations of Protected Townscapes, are often in practice not explicitly considered63. As a consequence, the dormer-windows on the painted façades just seem to hang in the air, since the volume of the dormer has not been modeled. However, this is only visible from the sides.
The three-dimensional models (house + roof) can also be displayed separate from the painted textures of the façades that are, like a piece of scenery, placed in front of the building volumes. This means that, contrary to traditional architectural drawings - e.g., the 1943 drawings - the façades do not show the roofs when detached from the building volumes. In the three-dimensional models, however, the roofs and the changing appearances of the buildings and façades are combined.
What cannot be seen, however, is the dilapidation and the sorrow state of disrepair of many buildings before the restoration. For that, photographs will always be needed. Many buildings in disrepair were plastered or painted in order to disguise the bad state of repair underneath64. Renewal of the brickwork or complete rebuilding of the façades cannot be seen in the models either. Much of the refreshed appearance of the townscape is due to the newly rebuilt façades. However, realistic coloring and textures are aspects which are left out of this analysis. Though out of scope in this study, a good way to deal with the changing colors and textures of a town would be by means of color scanning of color photographs which can be displayed in the same way as the images of the street walls.
Some of the decisions, in particular the leaving out of the relief of the terrain, the details of the backs, and the buildings within the blocks, have been difficult to take. However, in the plans of the period under study these were not considered important in the decision making process.
Applications and visualization of the development over time
Now that we knew how the models would have to be constructed and what limitations had to be applied, we needed to know how to show the transformation over time. In the Vismarkt project we have already tested and rejected the use of time-coordinates. Instead, it was possible to construct a three-dimensional model for each of the six periods. On the basis of the six reference dates, the development could thus be organized in layers-of-time. The complete model of a period would be too large for the computer to handle easily (the more information, the slower the processing speed). The model was therefore broken into parts, which were later merged for rendering and presentation.
Maps and town plans can be studied by using two-dimensional overlay techniques (as mentioned in the first section) or by using a combination of two-dimensional and three-dimensional information. The comparison of the building volumes was carried out by juxtaposition. Comparison of 3D objects by overlay or combination techniques appeared only partly possible. The result of a comparison in which each period was given a different semi-transparant color was that some differences could clearly be distinguished from a certain angle but other parts were blurred or appeared highly ambiguous to interpret. As a consequence, it was decided to use the juxtaposition of 3D models for analyzing the spatial transformation process.
It is also possible to study the extent of scaling-up or down, the difference of heights or proportions in the townscape. By animation or animated walk through in each of the six visualized periods, the changes can be physically experienced. Another option is to make still images of each period from the same viewpoint which allows for a uniform analysis.
Before using the computer for input of data, much time has to be spent planning and structuring the project and, most of all, defining and explaining why certain elements are important to be visualized, whereas other elements are not. For making a historical reconstruction by means of computer visualization techniques, the data-acquisition and structuring of the information is probably the most important phase of the study.
The production of abstract, standardized graphical representations, whether they are drawn manually or by means of CAD, allows for analyzing differences, similarities and continuities in the city in a uniform way. Drawing forces one to look intensively and to distinguish between characteristic features and additional elements. For presentation purposes, the use of the axonometric appears to provide good insight into the spatial morphology of a complete town or parts of it whereas the perspective in the street lends itself more for viewing the townscape from close by.
Though most of the projects discussed here can in principle also be carried out manually, the examples demonstrate that a computer is much more flexible in handling and (re)grouping information, changing viewpoints, making comparisons with overlay techniques, morphological and perspective verification, and reconstruction of (partly) destroyed buildings and cities. The graphical computer can thus be used as a visual database, which enables us to visualize those elements specifically selected for a purpose.
It has turned out that much time had to be spent on the interpretation and ordering of the visual sources and subsequently on defining the limitations with respect to elements that are important for the project and elements that are not. >From the different solutions to visualize the townscape three-dimensionally we have eventually decided to use the simple shaded geometrical model in combination with painted texture maps for the façades which are projected on to the surfaces of the model. The development over time can in the present project best be visualized by means of the six layers-of-time.
Notes:
1. Stenvert 1989 and 1991. See also: Lansdown 1989 and De Roode 1990.
2. For general literature about computer graphics, visualization and their applications, see for example: Lewell 1985; Scott 1984; Hearn & Baker
1986; Marshall 1987; Bridges 1989.
3. For literature about CA(A)D and visualization: for a general introduction in CAD: Schmitt 1988; W.J. Mitchell 1990; Mitchell et al. 1987; a
more technical book is Foley & van Dam 1982 (1989)2nd; recent developments and applications can be found in the conference proceedings of
CAAD-Futures: McCullough et al. 1990 and Schmitt 1992; and the proceedings of ACADIA and ECAADE. Journals such as Computer-Aided
Design (computer theory and research), Environment and Planning (computers in planning and design), Leonardo (computers in the arts), also
provide information on the subject. For computers and history, see: Boonstra et al. (eds.) 1990.
4. See, for example: Collins Concise Dictionary, London/Glasgow, 2nd. ed., 1988; New Illustrated Webster's Dictionary of the English
Language, New York 1992.
5. Wright 1990, 69.
6. Stenvert 1991, 103.
7. Cf. Fortier, Chapter I, 1.4.
8. About the architectural drawing and its conventions, see for example: Drexler 1977, 13-59; Prak 1987; Blau & Kaufman 1989; Mitchell 1990,
65-69.
9. See, for example: Archeologische en Bouwhistorische Kroniek van de Gemeente Utrecht, Utrecht 1990.
10. Cullen 1961, 17.
11. Mitchell 1990, 22.
12. Wright 1990, 65-73.
13. Durand 1800.
14. Middleton & Watkin 1980, 30.
15. For the representation of the Ecole des Beaux-Arts: Drexler 1977.
16. Drexler 1977, 18-21. For a history of the axonometric: Scolari 1985.
17. Choisy 1899, Introduction.
18. Yve-Alain Bois 1983.
19. Wittkower 1962 [1973]; Frankl 1968 [1986], 6-8.
20. Cf. Stenvert 1991.
21. Alkhoven 1990.
22. The French call them therefore "Images de synthese". Forgia 1988. It should be noted that even though the models are constructed three-
dimensionally in the computer, the output is almost always two-dimensional: picture/photograph from screen, slide, plot, printed drawing,
animation, video, etc. However, software does exist with which three-dimensional physical models can be produced by means of CAD.
23. Cf. Broadbent 1989.
24. Maver 1989; 1991, and Grant 1991. See for a similar but traditional approach: Lynch 1976.
25. Cullen 1961.
26. Roos-Klein Lankhorst 1989.
27. Turner et al. 1992, in: Schmitt 1992, 511-520; Strauss 1991, in: Pittioni 1991.
28. Pelt & Seebohm 1990. See also Schmitt 1990.
29. Johnson, in: Jordan 1990, 43.
30. Cf. Lebahar 1983.
31. Stenvert 1991.
32. Schwartz 1988.
33. Johnson 1989.
34. Chiurazzi et al. 1992.
35. Candy et al. 1992.
36. Mortola et al. 1992.
37. See, for instance, the study being carried out by Kleyn 1992.
38. Van Voorden 1989; Korevaar 1992.
39. Herman et al. 1987, 58.
40. See, for an evaluation of several historical reconstruction projects: Novitski 1993.
41. De Cola et al. 1990.
42. Behringer 1991; Reilly 1989.
43. Gruber 1952.
44. A. Peetoom, Bestemmingsplan Heusden Stad 1965, Heusden 1965. The importance and implications of the Development Plan for the town
will be extensively dealt with in Chapter IV, and for that reason it will not be discussed here.
45. Peetoom 1965.
46. See, for example: Scholten 1975A; 1975B.
47. AXIS.
48. The dates are all based on information contained in the 1943 drawings by Ferd. B. Jantzen.
49. 1969, Peetoom archive.
50. Peetoom, notes on measured drawing.
51. Van Nispen tot Sevenaer 1949, 7-12.
52. Ibidem, 9-10.
53. The "1943 drawings" are part of the "restoration archive 1965-1979" of A. Peetoom which I had on loan.
54. In the "Streekarchief van het Land van Heusden en Altena" (local archive) in Heusden, there is an extensive collection of postcards and
photographs, produced between the turn of the century and now. More photographs and designs can be found at the "Rijksdienst voor de
Monumentenzorg" (RDMZ) in Zeist. The "Gemeentearchief" (council archives) of Heusden manages documentation ordered by street and
house number about the restoration of Heusden (ca. 1968-1990).
55. Margry 1987, 35.
56. A listing of both the quadrant system and the street-and-house numbers can be found in the Streekarchief, Heusden. Dossier 11, "Lijst
betreffende de nieuw aangebrachte huisnummering in de gemeente Heusden. In werking getreden 1 mei 1952".
57. For the project a surface modeler (Axis) was used and the models were rendered with Renderstar2.
58. This is an accurate method, provided that the original map is reliable. However, it consumes a lot of time.
59. Janse 1986. See also Chapter III.
60. The texture maps were painted with Autodesk's Animator Pro.
61. It should be noted that by using the drawing options of any CAD-system the facades can be much more detailed. This is important for the
creation of measured drawings but is not necessary for the present research project.
62. Denslagen & de Vries 1984, 106-113.
63. Temminck Groll 1985, 129-134.
64. Denslagen & De Vries 1989.
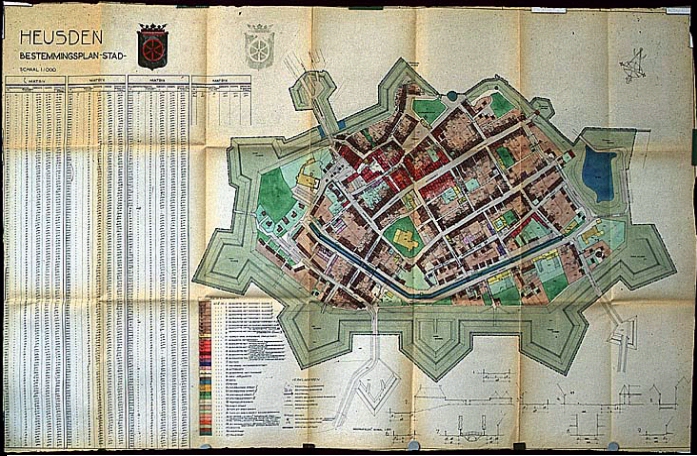
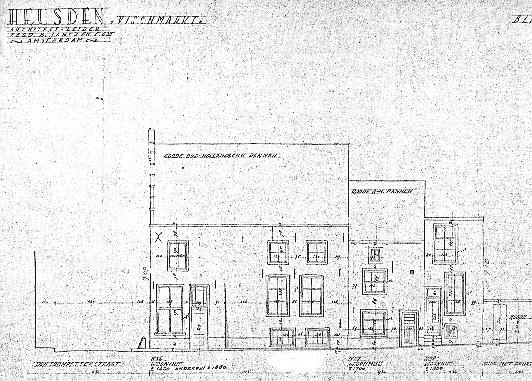
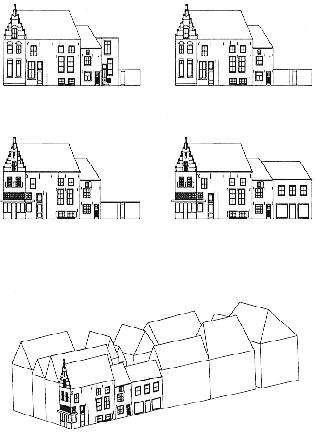